PISA: Can we compare the UK's education performance with other countries?
Last updated 14/04/2014
- PISA is often the main international measure referred to in debates on the UK's education performance, but its use can be problematic.
- It compares education performance in 65 countries and economies. Significantly different education systems in places such as Shanghai question comparability of overall scores.
- 2006 is as far back as the UK's performance in PISA data can be compared.
- The rankings have a margin of error which can affect the UK's position.
PISA is an attempt to measure the performance of 15-year-olds in maths, reading and science in 'real-life' situations. Each time it's produced, PISA places a particular focus on one of these subjects, with the other two assessed but to a lesser extent.
The Programme for International Student Assessment, to give it its full name, is produced every three years by the Organisation for Economic Co-operation and Development (OECD). In 2012, data was collected from the 34 member countries of the OECD and from a further 31 countries and economies.
Although PISA is the most politically prominent measure, there are other international measures which exist.
Join 74,000 newsletter subscribers who trust us to check the facts
Sign up to get weekly updates on politics, immigration, health and more.
Subscribe to weekly email newsletters from Full Fact for updates on politics, immigration, health and more. Our fact checks are free to read but not to produce, so you will also get occasional emails about fundraising and other ways you can help. You can unsubscribe at any time. For more information about how we use your data see our Privacy Policy.
While PISA data contains a number of problems, it can still point to potential trends within the UK and worldwide. For example, the measure highlights a divergence in education performance across the UK, with Wales performing consistently lower across all subjects than the rest of the UK. This led the Welsh Government to take the step in December 2012 to commission the OECD to undertake a country review of education in Wales.
Shanghai High?
PISA measures the performance of pupils in different 'areas' rather than countries. For example, Chinese pupils are tested in three separate areas: Shanghai, Hong Kong and Macao.
Distinct education systems mean that the test results for these areas may be influenced by the socio-economic backgrounds of the pupils who sit the test.
For example, Shanghai — which topped the rankings in 2012 — currently has what's known as a Hukou system. It's a household registration system where the rural population is given access to land, while urban hukou holders get access to town services and public schools. Academics at the Brookings Institute in America have argued that this has a significant impact on pupil performance in Shanghai, since children of the large migrant population (a reported 10-11 million migrants out of 23 million total) cannot attend the public schools. They say that the parents in the urban population tend to be drawn from a cultural and economic elite, whose children in turn tend to perform better academically. By contrast, the UK PISA data captures a wider spectrum of pupils.
The difference in the proportion of the population covered by PISA in each country has also been criticised in a recent Commons Education Committee meeting. The PISA coverage for Shanghai is 79% of 15 year olds, while in the UK it is 93%.
But Andreas Schleicher from the OECD told the Committee that even taking the "fairest comparison" of children with similar socio-economic contexts, children in Shanghai still outperform those in the UK. The OECD's 'PISA in focus — 2014/02' compared pupil performance by parental occupation, finding that pupils with parent(s) in elementary occupations (generally those who belong to manual professions) still performed better than pupils of professionals in the UK.
Still, Professor Tom Loveless at the Brookings Institute argues that there are problems with this comparison too. A child's scores might be counted in the 'elementary occupation' category for one parent, but their other parent might be classed as a professional and so they'd be counted in that category too. Professor Loveless told us that the argument remains that the pupil populations are too different to compare, with the raw data showing that 19.5% of Shanghai pupils had parent(s) in the 'elementary occupation' category, while 35% of UK pupils did.
Only comparable back to 2006
The OECD itself, academics and the UK Statistics Authority have all warned that comparisons to the UK's performance in previous PISA studies is only possible between 2006 and 2012 because of weaknesses in the data.
There are a number of reasons for this: in 2000 and 2003 the UK did not reach the standard level of test responses deemed necessary by the OECD; the date at which the test took place was moved to earlier in the academic year in 2006, which meant the profile of the students who sat the test changed; and from 2003, Welsh students were included, who tend to have significantly lower levels of achievement in the test.
Dr John Jerrim at the Institute for Education points out that UK PISA scores between 2000 and 2009 show a decline, where another widely-used measure, TIMSS, found performance had improved.
Additional countries or economies joining the PISA measure may also have an impact, Dr Jerrim warns. Most of these occurred before 2006, but in 2009 eight more areas took part, which could impact on changes in the OECD mean scores and rankings between 2006 and 2009.The OECD have said that 71 economies are signed up to participate in 2015.
Beware of rankings
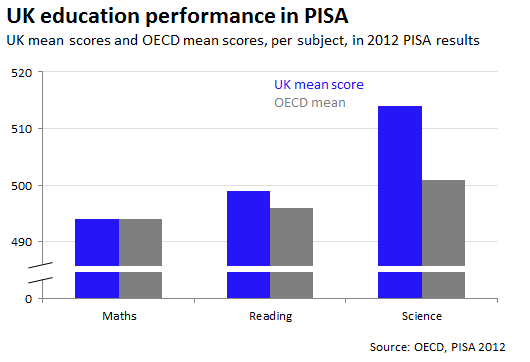
PISA assigns each country a score based upon the mean performance of the students taking part. In 2012, the UK scored 494 points in maths (exactly the same as the average score across the OECD countries), 499 points in reading (OECD average: 496) and 514 points in science (significantly higher than the OECD average of 501).
If we take the ranking of the UK in 2012, and compare it to the ranking it had in 2006 (out of 57 economies) and 2009, it appears that there has been some fluctuation in UK performance:
- Maths performance ranked 24th in 2006, 28th in 2009, and 26th in 2012.
- Reading performance ranked 17th, 25th and 23rd respectively.
- Science performance ranked 14th, 16th and 20th respectively.
But we can't read too much into this.
Because the scores are calculated from a sample of pupils, there is a margin of error attached to these rankings. Where countries perform similarly to each other, taking account of this error can change the rankings. For example, the OECD says that the UK could place anywhere between 23rd and 31st for maths.
Looking at the tests scores shows a more stagnant picture. Between 2006 and 2012, UK scores have not significantly changed in any of the subjects tested.
Still, this only gives us a picture of the performance of a sample of 15 year olds and in a particular way of testing.
Looking at TIMSS data, which tests two different age groups and using different testing methods to PISA, also shows a similar picture for England. It finds that English performance has remained largely constant since 2007, apart from science performance of year 5 pupils which has fallen.
Academics and journalists alike have queried how reliable PISA is and indeed whether we can conclude anything at all from the measure. It's important that we consider any findings within this context.
Further reading:
The Economist, How accurate are school league-tables? (December 2013)
Times Education Supplement magazine, Is Pisa fundamentally flawed? (December 2013)
Svend Kreiner, Analyses of model fit and robustness. A new look at the PISA scaling model underlying ranking of countries according to reading literacy, (June 2013) (£)