PISA's international league tables: what they do and don't tell you
- It isn't always possible to say with certainty from looking at a country's rank in the PISA educational league tables alone whether one country or economy has definitely performed better than another.
- England's position in the league tables is dependent on which countries and economies participate in a given year and whether the performance of these countries and economies is better, worse or the same as in the last round of PISA.
- England has maintained the same level of performance in maths in the last three rounds of PISA (2006, 2009, 2012). England's relative position compared to the number of higher performing countries and economies has remained relatively stable over time, although some countries have overtaken England and are now performing significantly better.
- PISA data alone doesn't tell us why some countries and economies are higher achieving, why some pupils perform better than others or which teaching practices result in higher performance.
The Programme for International Student Assessment (PISA) is a survey of the educational achievement of 15-year-olds developed by the Organisation for Economic Co-operation and Development (OECD). PISA assesses students' maths, science and reading skills. 15-year-olds from across the world take tests in the three key subjects, with a focus on one subject in each year of the assessment.
In PISA 2012, the main subject was maths and in the next PISA survey in 2015 the focus will be on science.
All four countries of the UK participated in PISA 2012. This briefing document focuses on England. Where relevant the briefing also references the findings for the whole of the UK.
This piece sets out to explore how PISA results can be used to judge the success of education systems, particularly in terms of the claims that are made about PISA findings by politicians and the media. There are ongoing debates surrounding the methodology of PISA (for example, see this piece in the TES), which this piece does not seek to address.
Join 74,000 newsletter subscribers who trust us to check the facts
Sign up to get weekly updates on politics, immigration, health and more.
Subscribe to weekly email newsletters from Full Fact for updates on politics, immigration, health and more. Our fact checks are free to read but not to produce, so you will also get occasional emails about fundraising and other ways you can help. You can unsubscribe at any time. For more information about how we use your data see our Privacy Policy.
Here's what it can tell us…
- England's performance has generally stayed the same since 2006
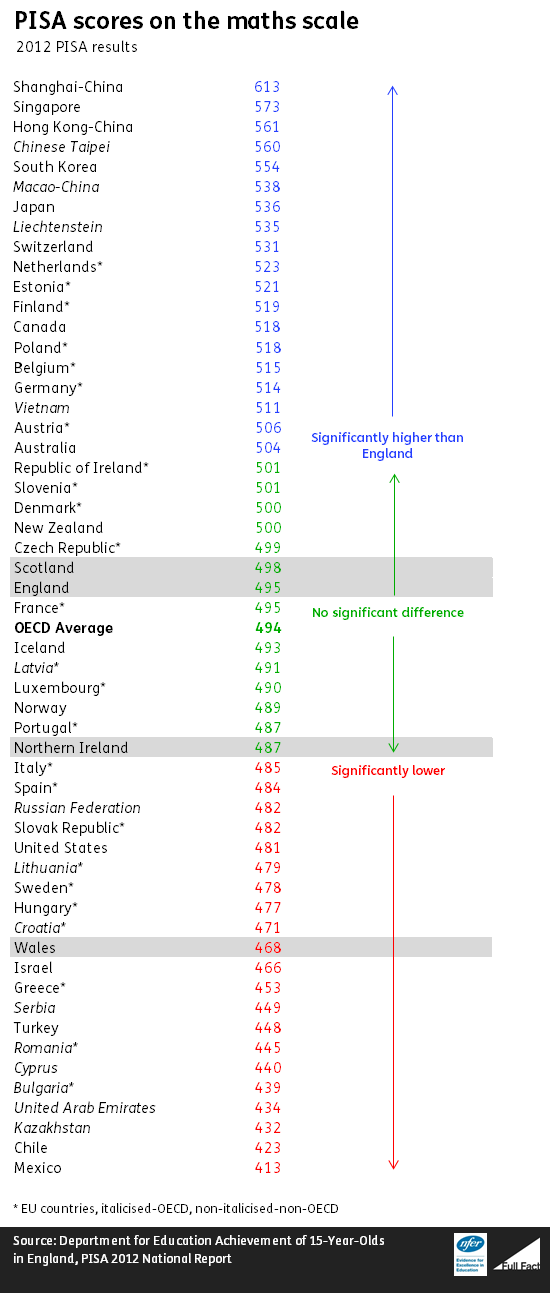
When the results of PISA 2012 were released, the focus from politicians and the media was primarily on how the UK ranked against the other participating countries and economies. Michael Gove, Secretary of State for Education at the time, claimed "Our performance in these league tables has been at best, stagnant, at worst declining. In the latest results we are 21st amongst 65 participants in the world for science, 23rd for reading and 26th for mathematics."
However, while England (and the UK taken as a whole) may have been ranked 26th in the world for maths, based on its score there were actually only 19 countries and economies which significantly outperformed England.
Each country's PISA score has a margin of error associated with it (because of factors like not every pupil in the country is tested, and because the pupils who are tested may have performed particularly well or badly on the day). This means we cannot conclude that differences between similar scores (over time or across countries) reflect genuine differences in performance or have arisen simply due to chance. Differences which are large enough that they're unlikely to have arisen solely by chance are termed "significant differences".
So it isn't always possible to tell from looking at the rankings in the league table whether one country or economy has performed better than another.
Looking at whether this score is higher or lower than in the previous PISA assessment year also doesn't tell us accurately whether England has improved, or is 'in decline' or 'stagnating'. We have to establish whether the score for that particular year is significantly different from the score obtained previously. For example in 2006 England's PISA score for maths was 495, in 2009 it was 493 and in 2012 it was 495. Although the score has fluctuated over the three PISA assessment years, analysis by NFER found that, in 2012, England maintained the same level of performance in maths as in the previous two rounds of PISA (in 2009 and 2006).
If we want to get a sense of whether England is "falling behind global rivals" we can look at how many countries and economies outperformed England in a particular subject in the previous rounds of the PISA assessment. The number of countries and economies outperforming England in maths was 18 in 2006, and 20 in 2009—just above the 19 in 2012.
So England's position in terms of the number of countries and economies performing significantly better has remained relatively stable over time.
England's position relative to other countries and economies is not just based on our own performance. It's also influenced by which countries and economies participate and whether their own performance is better, worse or the same as in the last round of PISA. The significant improvement of some high-performing countries and economies since PISA 2009, such as Shanghai, Singapore, Macao-China and Poland, mean that England has fallen further behind these particular countries and economies.
England's performance relative to its global rivals also depends on who you count as global rivals. If you wanted to look at England's performance compared to other English-speaking economies, only one (Australia) had a maths score that was significantly higher than England's in 2012. (Canada also outperformed England but it's not considered to be a solely English speaking country as the tests there are administered in French too).
- The difference in performance in maths by low achieving and high achieving English students is relatively large
A country's average PISA score doesn't tell us everything someone might need to know to judge whether a country has a successful education system. For example, PISA also provides data on the 'spread' of achievement (the achievement gap). England has a relatively wide spread of achievement—that is, although there are a number of students who do well in PISA there are many who don't.
Five of the highest performing countries and economies have a wider achievement gap (Chinese Taipei, Singapore, Shanghai, South Korea and Hong Kong)—although their overall performance is better than that seen in England.
- Advantaged pupils are about two years ahead of disadvantaged pupils
The OECD finds that, on average, the performance difference between advantaged and disadvantaged students across the countries and economies participating in PISA is equivalent to more than two years of schooling. England's PISA 2012 maths data shows England is about average in this respect.
Three of the top five performing countries and economies in maths (Shanghai, Singapore and Chinese Taipei) perform worse than the average, for example in Chinese Taipei the performance difference between advantaged and disadvantaged students is equivalent to more than three years of schooling.
The OECD also uses the PISA data to evaluate how much socio-economic backgrounds determine achievement in each country. DfE analysis of the 2009 PISA data found that in England the effect of socio-economic background on reading attainment was greater than that seen on average across OECD countries. A similar picture was seen for maths attainment in PISA 2012, in only 12 OECD countries was the effect of socio-economic background on maths attainment larger than that seen in England.
Compared to the UK, backgrounds have less of an impact on performance in some of the high-performing countries and economies such as Canada, Estonia, Finland and Hong Kong.
- The majority of English students report being happy and satisfied at school
PISA 2012 was the first PISA survey that asked students to evaluate their happiness at school.
The PISA data shows that, on average, 80% of students indicate that they are happy with school and suggests that, according to the OECD, the majority of the countries and economies that participated in PISA 2012 are consequently able to "foster student well-being".
When NFER analysed the PISA 2012 national data, it found that students in England reported a similarly high sense of belonging and satisfaction with school, with 84% of students identifying themselves as happy at school, and 85% as satisfied with school.
This is a different picture to that seen in the highest achieving Pacific Rim countries and economies where, although, a high percentage of students in these economies are happy at school (82%-89%) they are not necessarily as satisfied with their schools (60%-81%). The exception is South Korea where a smaller proportion of students reported being happy or satisfied with their school (they came lowest in the happiness measure with only 60% of students reporting they were happy).
Without further information we do not know if this lower level of satisfaction is the result of students in the Pacific Rim countries and economies being more demanding consumers of education.
What PISA doesn't tell us…
- The success of East Asian countries and economies means that their teaching practices "make the difference"
PISA provides us with limited information about the teaching practices that are used in high-achieving countries and economies as it does not collect information about these directly from teachers. It only captures this information through reports from students about what they do in their lessons.
Other international surveys such as the Teaching and Learning International Survey (TALIS), TIMSS and PIRLS surveys collect information about teaching practices directly from teachers. We can use these to look at the link between achievement and particular teaching practices, but it still can't tell us whether the high performance of economies such as Shanghai, Singapore and Hong Kong is a result of specific teaching practices.
PISA can help identify which are the higher performing countries, and give us some indication of the things that are associated with higher performance. However, PISA can't give us a detailed understanding of why some countries and economies are higher achieving, why some pupils perform better than others or which teaching practices result in higher performance.
- Why certain students perform better than others
You may have seen this headline:
The UK is so far behind Shanghai that children of professionals here do worse than children of cleaners in Shanghai
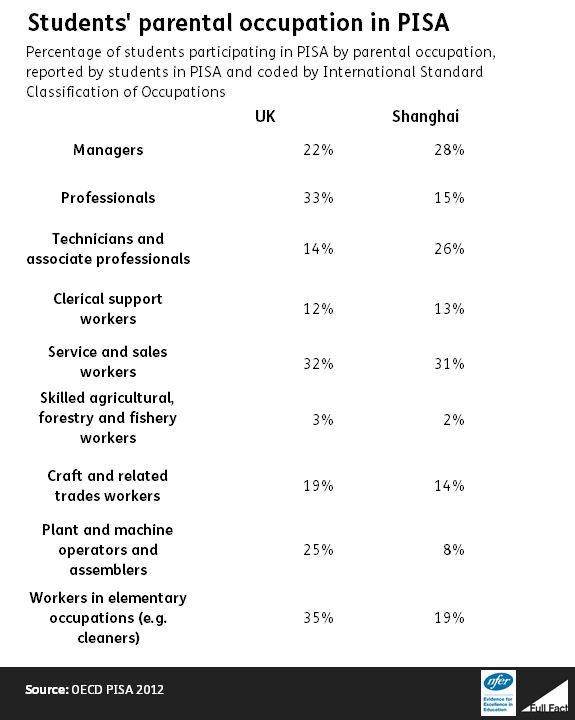
The OECD did find that in the UK students whose parents work as professionals do not perform as well in maths as either the children of professionals in other economies or the children of manual workers (e.g. in Shanghai and Singapore).
But when we compare PISA scores for a specific occupation across countries and economies we are not necessarily comparing like with like. For example 33% of students in the UK report having parent(s) working in professional occupations, while for Shanghai only about 15% do. The data is also based on students' responses of what their parents' occupations are, so there could be some error in the responses.
Simply looking at occupations does not take into account parent's expectations and aspirations for their children—and how this is manifested in what they do to encourage their children to be high achievers either. For example, do they spend time working with them on homework assignments; do they pay for tutors?
In some countries and economies, there may be greater parental expectations of children's performance; parents may put more pressure on their children to work harder; or they may invest more household income on private education.
The Nuffield Foundation found that in China increased parental expectations were the same across different socio-economic groups. Therefore, the expectations of parents employed in elementary occupations in one country may exceed the expectations of parents employed in managerial or professional occupations in another. We don't know what the case is in England.
Without looking at other background characteristics (many of which are not collected through PISA) it is not possible to say why students with parents in different occupational groups perform differently.
From this analysis, OECD researchers found that, in most countries and economies, the children of professionals have, on average, the best results in maths.
This briefing was written by Bethan Burge of the National Foundation for Educational Research in collaboration with Full Fact. This work has been funded by the Nuffield Foundation but the content is the responsibility of the authors and of Full Fact, and not of the Nuffield Foundation.
Update 6 May 2015
We have added in a note to be clear that this piece does not seek to address the methodological debates about PISA itself.