These poll figures are for leave voters - not "most of the nation"
19 July 2018
What was claimed
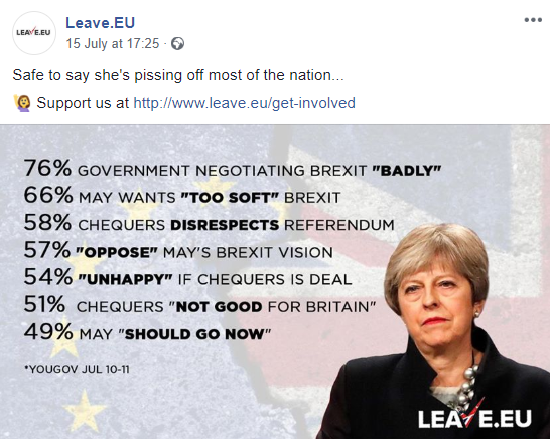
Polling figures show that Theresa May’s Brexit approach is ‘pissing off most of the nation’.
Our verdict
The numbers in the graphic refer to opinion among Leave voters only, not the public as a whole. Opinion of the progress of Brexit varies depending on what question is asked.
What was claimed
76% think the Government are negotiating Brexit badly.
Our verdict
That's of adults in Great Britain voting 'Leave' in the 2016 referendum, according to one survey. Among all adults in Great Britain, it's 75%.
What was claimed
66% think Theresa May is aiming for a Brexit that is too "soft".
Our verdict
That's of adults in Great Britain voting 'Leave' in the 2016 referendum, according to one survey. Among all adults in Great Britain, it's 40%.
What was claimed
58% think the Chequers deal disrespects the result of the referendum.
Our verdict
That's of adults in Great Britain voting 'Leave' in the 2016 referendum, according to one survey. Among all adults in Great Britain, it's 39%.
What was claimed
57% oppose Theresa May's Brexit approach.
Our verdict
That's of adults in Great Britain voting 'Leave' in the 2016 referendum, according to one survey. Among all adults in Great Britain, it's 53%.
What was claimed
54% would be unhappy if the Chequers deal was carried through.
Our verdict
That's of adults in Great Britain voting 'Leave' in the 2016 referendum, according to one survey. Among all adults in Great Britain, it's 43%.
What was claimed
51% think the Chequers deal is not good for Britain.
Our verdict
That's of adults in Great Britain voting 'Leave' in the 2016 referendum, according to one survey. Among all adults in Great Britain, it's 42%.
What was claimed
49% think Theresa May should stand down.
Our verdict
That's of adults in Great Britain voting 'Leave' in the 2016 referendum, according to one survey. Among all adults in Great Britain, it's 42%.
This week Leave.eu, an organisation campaigning for Brexit, circulated figures about public sentiment towards the Chequers deal and the Government’s approach to Brexit negotiations.
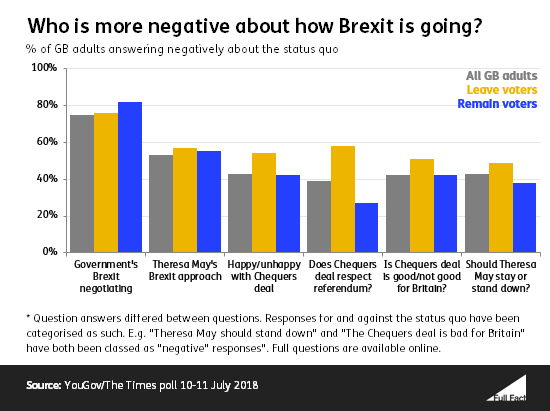
But these figures don’t refer to the survey’s results from general public as a whole – they are for Leave voters only. When you look at all adults across England, Scotland and Wales, according to the survey it’s still the case that more people are dissatisfied with the government’s Chequers deal than satisfied, but to a lesser extent.
Leave voters are about as dissatisfied with the government’s general negotiating approach as the general population.
Join 72,547 people who trust us to check the facts
Subscribe to get weekly updates on politics, immigration, health and more.
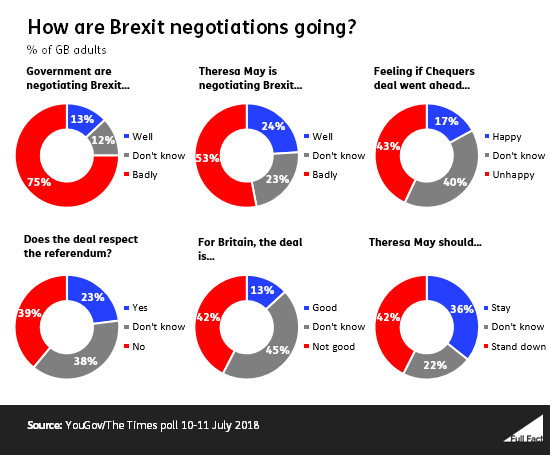
What does the data say?
The data comes from a YouGov/Times survey of a representative group of British adults on the ongoing Brexit negotiations—specifically the so-called “Chequers deal”.
It found that more people are not in favour of the deal than in favour of the deal. It also found that 40% of adults in Great Britain thought the deal was too soft, 12% thought it was too hard, 13% thought the balance was right, and the remaining 35% answered “none of these” or “don’t know”.
The data in the claim which showed a majority opposing the deal looked only at the results of the people surveyed who voted Leave in the 2016 referendum. The post referred to Theresa May “pissing off most of the nation”.
While it’s true that leave voters were “most” of the people who voted in the 2016 referendum, Leave voters are not “most of the nation”. In mid-2016 there were an estimated 52 million adults in the UK, of whom 17 million (34%) voted leave. So it’s inaccurate to use figures for Leave voters only to describe “most of the nation”.
Leave voters are more negative about the deal than the population as a whole, and according to this survey, a majority of them (54%) would be unhappy if the Chequers deal went ahead. They’re also less likely to think the deal hit the right balance between “soft” and “hard” Brexit.
Nevertheless across the population far more people appear to be unhappy with the Chequers deal than are happy with it (no matter which way the voted in the referendum). And a large majority of those surveyed (75%) think that the government is handling Brexit negotiations either “fairly badly” or “very badly”.
Surveys have limits
As with all surveys, there is a margin of error with the data. YouGov designed the survey, to ensure the views of the people it surveyed represent the views of the public, through sampling and weighting. However there are some factors that it’s still worth bearing in mind.
This survey only covers adults in Great Britain. So the people of Northern Ireland are not represented. Northern Ireland as a whole voted for Remain (unlike Great Britain) and issues around the Irish border may mean that Northern Irish people view the Chequers deal and ongoing negotiations in a different way from the rest of the UK. Therefore excluding their views on the deal and negotiations may skew the results of the data overall.
Also, there are fewer non-voters included in the survey than in the general population, it counts around 1,420 voters out of the total sample of 1,730— a turnout of 82% among all adults in Great Britain. The turnout among registered voters on the day of the EU referendum was only 72% among registered voters.
Non-voters surveyed were more likely to answer “don’t know” to the survey questions. So under-representing their views may also have skewed the results away from the “don’t know” responses.
YouGov told us it deliberately doesn’t include as many non-voters as were observed in the referendum for two reasons.
Firstly, it expects that some of the 1,420 people saying in the survey they voted Remain or Leave, did not in fact vote.
Secondly it questioned the 72% turnout figure saying incompleteness, inaccuracy and double-registration in the register mean that the turnout could have in fact been higher than 72%. Though it did say this could have improved following the move from household electoral registration to individual electoral registration in 2014.
The Electoral Commission said that individual registration has improved the situation, there is the potential for further improvements to remedy these issues.
Thirdly, it said that polls struggle to contact the most politically disengaged people, and so weighting up the share of non-voters could also skew the figures by overemphasising the views of “engaged non-voters”. “Unengaged non-voters” may have different views that haven’t been captured.