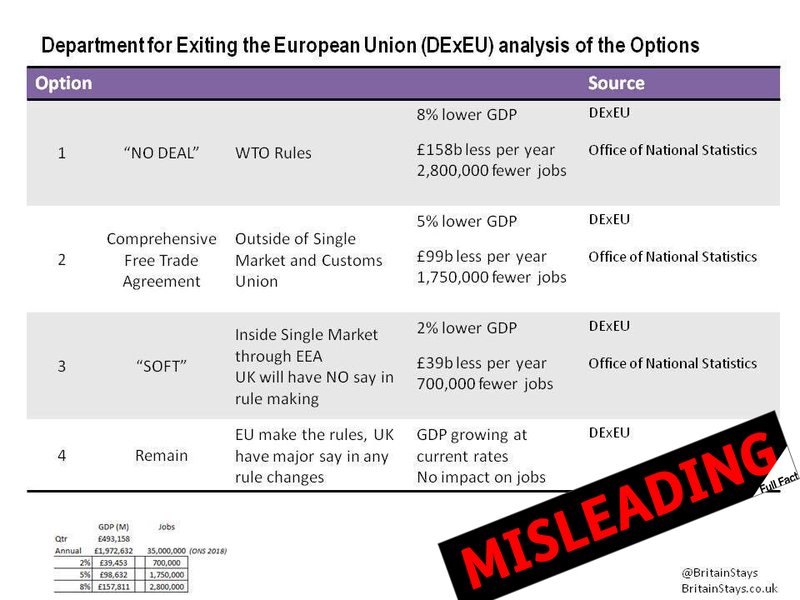
This viral image showing the cost of different Brexit deals is wrong in a lot of ways
23 July 2018
What was claimed
Options for post-Brexit trade deals with the EU will lead to between 2% and 8% lower GDP.
Our verdict
This is based on government analysis of 3 hypothetical deals, which explicitly can’t be used as economic forecasts and are very uncertain. According to the analysis GDP will continue to grow over the next fifteen years in each case, but more slowly than on existing OBR projections.
What was claimed
Options for post-Brexit trade deals with the EU will lead to between £39 billion and £158 billion less per year.
Our verdict
This is based on government analysis comparing 3 hypothetical deals to existing GDP projections, which explicitly can’t be used as economic forecasts and are very uncertain. Were they to be used anyway, these are figures for a 15 year period, not one year.
What was claimed
Options for post-Brexit trade deals with the EU will lead to between 700,000 and 2,800,000 fewer jobs.
Our verdict
There is no evidence for this in the report cited by the claimant, nor elsewhere.
This graphic has been shared widely on social media. Just one tweet sharing it has received over 15,000 retweets at the time of writing.
It’s based on government analysis, produced in January, of three possible post-Brexit trade scenarios with the EU (none of the three possible deals are as detailed as the government's recent white paper on the matter). The analysis compares how each deal might affect the economy.
The graphic’s reporting of the analysis is highly misleading. For a start, the government report explicitly states that it’s based on hypothetical modelling and should not be used to make economic forecasts for each trade deal. This means it can’t be used—as the graphic does—to estimate the future size of GDP, or number of jobs.
Even if we ignore this, most of the figures reported by the graphic are still incorrect. The GDP figures are roughly accurate, but the phrasing may be confusing—the government analysis still expects GDP to grow in each scenario, just more slowly. So “8% lower GDP” under “no deal” means GDP will still have grown, but more slowly than on the Office for Budget Responsibility’s (OBR) latest economic forecasts, over a fifteen year period.
The “less per year” figures are wrong, as they refer to the how much less the economy might grow by over fifteen years, not every year. And there is no evidence for the estimated job losses they report in either the government analysis or wider research.
Join 72,547 people who trust us to check the facts
Subscribe to get weekly updates on politics, immigration, health and more.
The government analysis is not an economic forecast
To begin with, it’s important to clarify that the government analysis on which this graphic is based explicitly says that this is not a forecast for what will actually happen to the economy in each scenario. It’s only to give a comparative sense of each deal’s potential impact.
The government uses the OBR's current economic forecasts up to 2023 (and then extrapolates them over 15 years) in order to create a baseline for economic growth. They then model three different Brexit scenarios against this baseline, and show how GDP growth varies in each one.
But the report recognises that future economic uncertainty could affect the analysis, and also that it doesn’t account for short-term impacts from Brexit—so it’s not an official economic forecast for each trade deal.
GDP would still grow in each scenario, but more slowly
Although it’s not a forecast, the analysis does give an indication of the comparative impact of different trade deals. GDP is not expected to fall in any of the three Brexit scenarios, but it is expected to grow more slowly in each scenario over a 15 year period (with the caveats outlined above about the uncertain path of growth, and there being no modelling of short-term impacts).
For instance, growth is expected to be around 17% over 15 years based on the no deal model, compared to 25% on the baseline model. Put another way, that’s 1.1% average growth each year in the no deal model, compared to 1.5% on the baseline.
These estimates are also mid-points within quite wide ranges. This means that growth in the no deal scenario is estimated to be anywhere between 5% and 10% slower.
(For the sake of clarity, this article focuses mainly on how the graphic reports the no deal scenario, but the issues with the calculations apply to all three trade deals equally.)
The cost estimates refer to a fifteen year period, not one year
The graphic tries to translate the different GDP growth rates into costs to the economy. This can’t be done fairly because the analysis is explicitly not an economic forecast, but even if you ignore this factor, the graphic’s estimates are still incorrect.
It says that the no deal scenario will mean the economy having “£158 billion less per year”. This is actually how much less the economy might grow by over a fifteen year period, not one year. Using the 2017 GDP estimate from the Office for National Statistics, if the economy grew by 17% over the next 15 years (as the no deal model roughly estimates), by the fifteenth year GDP would be around £155 billion less than if it had grown by 25%. But in each year before that the shortfall would be less, so it’s wrong to say that this is the figure lost “per year”
The jobs estimate is frankly inexplicable
We don’t know what the impact of Brexit will be on jobs, but there’s no evidence in the government report to support the graphic’s calculations (which is where the makers of this graphic say their information is from). Separate research has suggested that a “pessimistic” no deal scenario could lead to significantly fewer jobs by 2030 (we haven’t verified these calculations), but it’s still nowhere near the 2.8 million figure claimed here.
The graphic seems to directly translate the estimated difference in GDP growth rates in each scenario into an equivalent difference in the number of jobs. So an 8% slower GDP growth rate under no deal is equated to 8% fewer jobs, which they calculate as 2.8 million fewer jobs. (They don’t specify if this is job losses, or simply a slower increase in the rate of jobs, nor what time period this relates to.)
But that’s not how the growth rates of GDP and jobs are related. 2.8 million jobs lost over 15 years, while the economy continues to grow, would be unprecedented. If the assumption is that jobs continue to rise, but by 2.8 million less, then the implication is that the rate of jobs growth and the rate of GDP growth are identical.
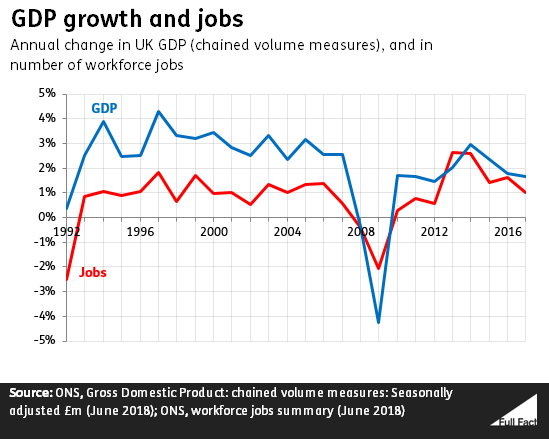
That’s not how it works. The graph below shows that, while changes in GDP growth and job numbers generally track each other, GDP tends to rise and fall more sharply than jobs.
As an illustration of how unlikely it is that GDP growth and jobs growth would exactly match each other, as this claim assumes: if jobs grew at the rate GDP is expected to grow under the baseline model, then within the next few decades there would be millions more jobs than there were adults of working age in the country (based on the ONS’s population projections). Which is pretty implausible, even if lots of people work two jobs.
There is no forecast for remain
It should also be noted that the scenarios modelled by the government report are all quite general. They don’t have anything like the level of detail that, for instance, the government’s Brexit white paper has, in terms of the minutiae of trade agreements. Any Brexit deal we do strike will not exactly resemble the EEA-Type or FTA-Type scenarios of the report.
And neither do the OBR’s forecasts, used as a baseline in the report, amount to a “remain” scenario, as the graphic suggests. The OBR forecasts are based on economic projections for the UK at present—a country which is in the process of leaving the EU, having triggered Article 50 and committed vast governmental resources to planning and negotiating Brexit—not a hypothetical scenario in which we decide to remain in the EU.