Is the latest Ofsted report based on sound evidence?
"The landmark survey, The most able students: are they doing as well as they should in our non-selective secondary schools?, finds that too few maintained schools and academies set high enough expectations of what their brightest students can achieve." Ofsted, 13 June 2013
"The findings appear to be based on the flimsiest of research evidence. Whilst there is no room for complacency, the Chief Inspector seems to be ignorant of the fact that schools in England are among the best in the world." NASWUT, 13 June 2013
"The good practice and recommendations highlighted in the report are useful, but I have real concerns about Ofsted's evidence base for drawing these conclusions." Brian Lightman, Chief Executive of the Association of School and College Leaders, 13 June 2013
This article was updated on 15 June 2013
Join 73,000 newsletter subscribers who trust us to check the facts
Sign up to get weekly updates on politics, immigration, health and more.
Subscribe to weekly email newsletters from Full Fact for updates on politics, immigration, health and more. Our fact checks are free to read but not to produce, so you will also get occasional emails about fundraising and other ways you can help. You can unsubscribe at any time. For more information about how we use your data see our Privacy Policy.
Are state schools stretching their most able pupils? Not according to new research from the independent Office of Standards in Education (Ofsted), which carried out a survey of 41 non-selective state schools on the topic.
The report - The Most Able Students: Are they doing as well as they should in our non-selective secondary schools? - has been met with a fair amount of criticism. Teaching unions, in particular, have accused the schools inspection service of attacking comprehensive schools on "flimsy evidence" and " sweeping generalisations".
So, what is the basis of Ofsted's claims?
Here's what Ofsted says:
The report's main finding is that last year, nearly two-thirds (65%) of students who achieved a level five or above in the key subjects of English and Maths at the end of primary school did not get an A or A* in the same subjects at GCSEs in non-selective schools. In selective state schools - i.e. grammar schools - it was 41%.
To explore this, and other, conclusions, the inspectors visited 41 non-selective secondary schools across England in March 2013. Of these, 18 were academy converters and 23 were other types of secondary school. 27 were 11-to-18 secondary schools, two were 11-to-19 schools, 11 were 11-to-16 schools and one admitted students at Year 9.
Inspectors also visited three selective schools for comparative purposes but their data and the evidence gathered there were not included in the report.
Ofsted has argued this is evidence that a culture of low expectations has pushed schools and pupils into the "middle ground":
"Many students become used to performing at a lower level than they are capable of. Parents or carers and teachers accepted this too readily. Students did not do the hard work and develop the resilience needed to perform at a higher level because more challenging tasks were not regularly demanded of them."
The Ofsted findings were endorsed by the Department for Education. So is this evidence enough?
Why critics disagree
Teaching unions such the National Association of Schoolmasters Union of Women Teachers (NASUWT) and the Association of School and College Leaders (ASCL) raised questions over strength of the evidence supporting these claims.
Writing for the Huffington Post, Chris Keates - General Secretary of NASUWT- said the sample selected by Ofsted was too small:
"It is nothing short of scandalous that sweeping generalisations based on extrapolating data from 41 schools are being used to condemn standards in the other 4,500."
The 4,500 schools that Ms Keates highlights perhaps slightly overstates the scale of the disparity with Ofsted's sample, as his figure includes selective schools, whereas Ofsted's report focuses on the non-selective state-funded sector which counts 3,000 institutions.
The ASCL has also argued that "Level 5 is a wide band that that includes a range of ability levels, not just the brightest students."
High-attainers are, according to Ofsted, those pupils who achieve a Level 5 in both English and maths in their Key Stage 2 national curriculum tests or SATs, whereas Level 4 is the 'expected' level for all pupils.
Lastly, there's this argument, advanced by the ASCL general secretary Brian Lightman on BBC News:
"The Government has said that for children who come into secondary school with a level 5, expected progress means a B at GCSE. Of course we want those children to achieve even higher, but for Ofsted to say that they are underachieving if they don't get an A or A* is unfair to those students and their teachers."
What does the data say?
Ofsted and the Department for Education run an online tool called RAISE Online the acronym stands for "Reporting and Analysis for Improvement through School Self-Evaluation"). The system allows us to dig out national curriculum test data for KS1, KS2 and KS4 at the individual pupil level.
We had a look at what are known as the "Transition Matrices": data which tracks the Key Stage 2 results of pupils and their subsequent achievements at GCSE Maths and English exams. This data relates to a greater variety of secondary schools from the ones in Ofsted's report, for example non-maintaned special schools are also taken into consideration.
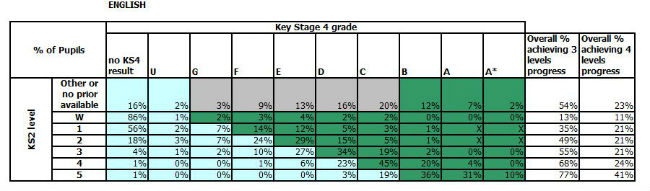
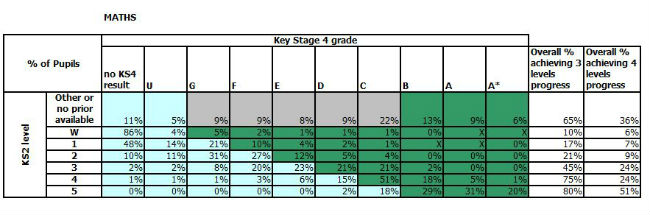
The tables below show the percentage of GCSE students in 2012 from each 'prior attainment starting point' (their result at KS2) who have either achieved expected progress or exceeded it (in green). The light blue cells show the proportion of pupils who have not made expected progress. The grey cells represent those pupils for whom there isn't KS2 data available, so it is impossible to know if they are making expected progress beyond those performing well or badly by any standards.
Let's see if this data corroborates what Ofsted found.
The first table shows the progress for pupils studying English.
And here's maths:
So we can see that:
- 41% of those achieving 5 in English at KS2 went on to achieve A* or A at GCSE; 75% if you also consider those who went on to achieve a B.
- 51% of those achieving 5 in Maths at KS2 went on to achieve A* or A at GCSE, 80% if you also consider those who went on to achieve a B.
Ofsted's report found that 38% of those gaining Level 5 at KS2 went on to get an A or A* at GCSE, while 47% do likewise in maths. This would suggest that the data used by Ofsted was slightly below average, but not by much.
Does this mean that Ofsted's conclusions about the number of schools failing gifted students are justified? This depends on what we understand by 'expected progress', and it's worth noting that if we take the Goverment's understanding of it and look at those pupils who gain a B or higher at GCSE having attained Level 5, the picture looks more rosy: 77% make expected progress in English, and 80% do so in maths.
---
Special thanks to blogger Gifted Phoenix for his help with the analysis of the matrices.
Flickr image courtesy of theirhistory