Several newspapers reported this week that the average wait for patients who want a GP appointment has passed two weeks for the first time.
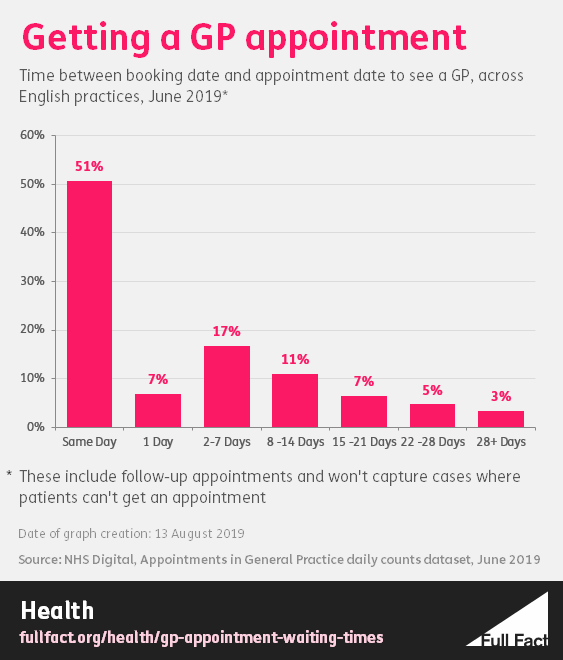
For a start, this is a simplification. As several of the stories go on to note, this refers to non-urgent GP appointments. It’s still the case, for example, that just over 40% of appointments at GP surgeries in England are for same-day slots and over two thirds are within seven days, according to estimates from NHS Digital.
But even for non-urgent appointments, these figures can’t reliably tell us how long patients are waiting on average, and certainly not to what extent patients are getting the speed of service they want.
Where the number comes from
The findings are based on an annual survey by Pulse Magazine, a magazine for GPs across the UK. It advertised a survey to its readers and email subscribers asking different GP practices, among other things: “How long is the average waiting time for non-urgent appointments at your practice?”
The options practices were given spanned week-long periods: so “less than a week”, “1-2 weeks”, and so on, ending in “more than 5 weeks”. Pulse Magazine then took the mid-points of each range to get the average time (so if the average was 1-2 weeks, that would count as 10.5 days).
Based on responses from about 900 practices, it found an average time of just under 15 days, which is the highest figure it has found based on surveys in recent years.
There are several reasons why these findings can’t really tell us how long people are waiting for GP appointments.
Firstly, there’s no way to know whether the GP practices who responded to the survey are representative of practices across the UK.
Pulse told us it received responses from a range of practices across the UK and asked several questions in the survey, which it says was to avoid selection bias on one issue (in other words, to make it less likely they only got responses from practices that had particular issues with waiting times, for example).
It’s also true that Pulse has been asking this question consistently for several years, and found an upward trend in the average waiting time nonetheless.
But the second issue is that we don’t know how large the practices who responded to the survey are, and so how many patients they represent. Without knowing this, we can’t conclude how long patients across the UK are waiting on average. All we can really say is that these findings show that the average GP practice responding to this survey sees a waiting time of roughly two weeks, and that this has been rising in recent years.
A final point to note is that we can’t say how many of these appointments were to see an actual GP (which was implied by some of the reporting of the survey), as opposed to another healthcare professional based at the practice, for example a nurse. Data on surgeries gathered by the NHS, for example, shows only around half of all appointments at practices are with GPs.
In England just over half of patients see a GP on the day they book an appointment.
What do “waiting times” even mean?
It’s tempting to see figures on GP waiting times and picture frustrated patients waiting several weeks to get appointments when they would rather get one within days.
This kind of experience will certainly be reflected in the figures, but the reality is a bit more complicated.
Sometimes patients will want or expect a later appointment, due to their own availability or because the appointment is a scheduled follow-up from a previous one. Pulse Magazine said it expects GP practices will not have included follow-up appointments in their figures when responding to the survey, although given the wording of the question, there’s no guarantee every practice will respond in the same way.
This issue doesn’t just affect these figures. The NHS Digital data presented in the graph above similarly includes follow-up appointments and doesn’t really give an indication of how many patients are receiving the service they want, at least in terms of the convenience and speed with which they can get an appointment.
The only source we’re aware of that actually measures whether patients are getting what they want in terms of appointments is the GP Patient Survey for England, which we’ve written about recently.
Recent findings from that show that in 2019, 11% of patients said they “never or almost never” speak to their preferred GP when they would like to, with another 41% saying they succeed “some of the time”.