Correct looking at the headcount of GPs (excluding locums) in England between September 2015 and 2018. Looking at the full-time equivalent number of this group, which gives a better idea of staffing levels, the numbers are falling.
What was claimed
GP numbers are experiencing their first sustained fall for 50 years.
Our verdict
Correct, looking at the number of GPs (excluding registrars, retainers and locums) per 100,000 people across the UK since 1964.
Theresa May and Jeremy Corbyn clashed at Prime Minister’s Questions over the number of GPs in the NHS. Both were correctly quoting their selected figures, but the problem was they were talking about two different measures.
Mr Corbyn was referring to the findings of a new report by the Nuffield Trust think tank. It found that the number of fully qualified, permanent GPs across the UK, per 100,000 people, “has fallen in a sustained way for the first time since the 1960s.” The same trend is true just when looking at England in isolation.
Mrs May was referring to the total number of GPs in England excluding locums. This figure went up by around 200 between September 2015 and 2018.
Both are using “headcounts” of GPs, and these figures don’t tell us anything about how many hours these GPs are working. There’s no way to account for this in Mr Corbyn’s figures as the data is limited, but it’s possible to account for this in the data Mrs May was using. Looked at this way it paints the opposite picture. The number of “full-time equivalent” GPs excluding locums fell by 330 over the same time period.
Health is a devolved issue so the UK government is only responsible for services in England.
Join 74,000 newsletter subscribers who trust us to check the facts
Sign up to get weekly updates on politics, immigration, health and more.
Subscribe to weekly email newsletters from Full Fact for updates on politics, immigration, health and more.
Our fact checks are free to read but not to produce, so you will also get occasional emails about fundraising
and other ways you can help. You can unsubscribe at any time. For more information about how we use your data
see our Privacy Policy.
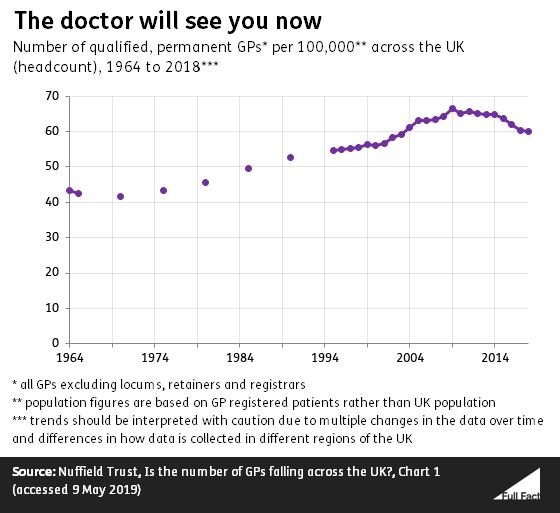
The number of GPs per person in the UK is falling
Research by the Nuffield Trust found that the number of GPs per 100,000 people across the UK has fallen from a high of around 67 in 2009 to 60 in 2018. That’s a similar number of GPs per person today as there were in 2004.
The last time there was a recorded drop in the number of GPs per 100,000 was in the 1960s—although the data from that time wasn’t published as regularly so we don’t have a complete picture of exactly what the numbers were doing. It fell from around 43 per 100,000 in 1964, to 42 in 1965, and just under 42 in 1970.
The figures exclude certain types of GPs: registrars (GPs in training), retainers (those on schemes to support people with a caring responsibility), and locums (GPs providing temporary cover).
The Nuffield Trust also adds that its figures might underestimate the fall in GPs per person. Factors like an ageing population could mean that we need more GPs to keep up with demand.
It also says the trends should be interpreted with some caution due to the fact that there are some data quality issues, figures from across the UK are not necessarily taken at the same time in every year, and the fact that in some years estimates had to be made as to the number of GPs in a small proportion of practices that didn’t report their staffing levels. There are also problems with the changing definitions of who is included in the figures over time which mean we should be cautious about comparisons.
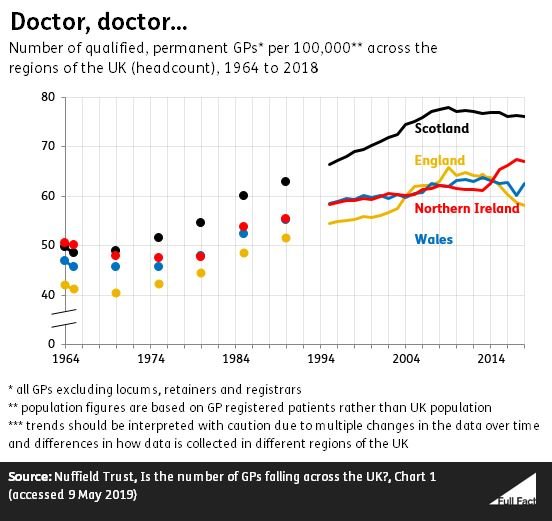
The trend is the same in England, but not in every part of the UK.
In Northern Ireland the number of GPs per person has largely been rising in recent years. In Scotland, the overall number of GPs per person is higher than in the rest of the UK, but has also been falling since 2009 (though less sharply than across the UK as a whole). In Wales the trend has been largely flat in recent years.
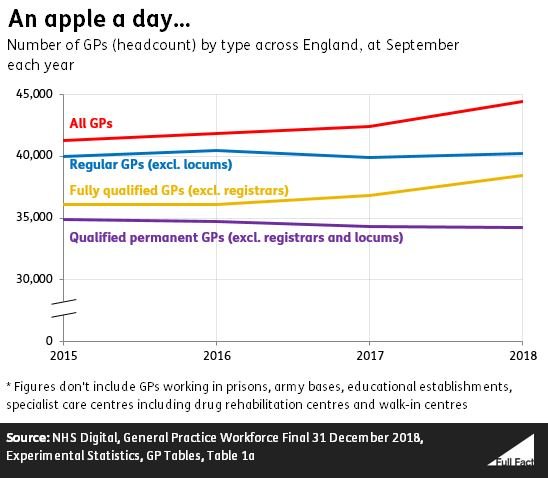
The number of GPs in England rises or falls depending on how you count it
The Department of Health and Social Care told us that Mrs May was referring to the headcount number of permanent GPs (all GPs excluding locums) in England. The number rose by 208 between September 2015 and September 2018 (the most recent comparable figures). That’s an increase of about half a percent.
The trend in the number of GPs across England depends on how you count them. If you look at all GPs, including registrars and locums, the number increased by around 3,150 between September 2015 and 2018. If you exclude all registrars and locums then the number fell by 660. In other words locums and registrars are what’s increasing the number of GPs while within that picture the number of fully trained, permanent GPs is falling.
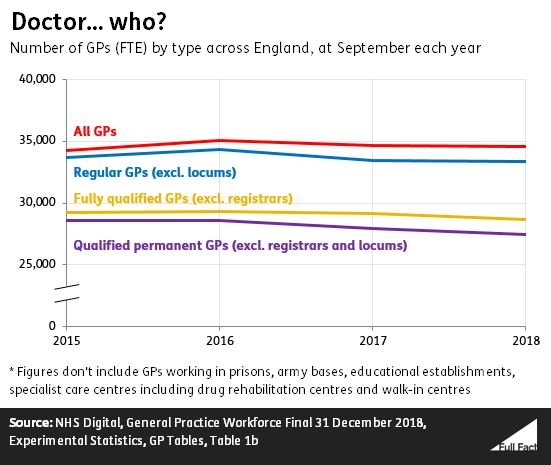
Looking just at the headcount figure, or the total number of people employed in a role, doesn’t tell us much about the working capacity those people have. To do this we can look at the number of hours they all work and add these together to work out how many full-time roles they make up, known as the full-time equivalent (FTE).
The number of FTE permanent GPs (the equivalent FTE measure of the type of GPs that Theresa May was counting), the number fell by 330 between September 2015 and 2018. Looking at all FTE GPs the number rose by 270 and excluding registrars and locums it fell by around 1,180.
The data the Nuffield Trust based their report on only provides headcount figures, rather than FTE, as not all of the regions of the UK regularlypublish data on FTE GPs.
Fact checking claims made by politicians, public figures and viral online content can give you the full picture backed by the evidence.
Subscribe to weekly email newsletters from Full Fact for updates on politics, immigration, health and more.
Our fact checks are free to read but not to produce, so you will also get occasional emails about fundraising
and other ways you can help. You can unsubscribe at any time. For more information about how we use your data
see our Privacy Policy.