Incorrect. Growth in overall life expectancy has slowed down and almost stopped after over a century of increases. Life expectancies are falling in certain local authorities within the UK.
“Shortchanged: Why British Life Expectancy Is Falling
“For the first time in modern history, Britons are living shorter lives, with poor lifestyles, depression and budget cuts the leading causes.”
This (since corrected) headline from the New York Times is incorrect. Overall life expectancy in the UK is not falling, but it is stalling.
Life expectancy in the UK has been rising for well over a century, and in recent years that growth has slowed down considerably and has almost stopped.
If you dig beneath those national figures, you can find cases of falling life expectancy in certain local authorities, including in Hartlepool—which the New York Times drew attention to in its piece.
The New York Times changed its headline after we contacted them and it now correctly reads that life expectancy has stalled.
Join 74,000 newsletter subscribers who trust us to check the facts
Sign up to get weekly updates on politics, immigration, health and more.
Subscribe to weekly email newsletters from Full Fact for updates on politics, immigration, health and more.
Our fact checks are free to read but not to produce, so you will also get occasional emails about fundraising
and other ways you can help. You can unsubscribe at any time. For more information about how we use your data
see our Privacy Policy.
Overall life expectancy in the UK has stayed roughly the same for several years
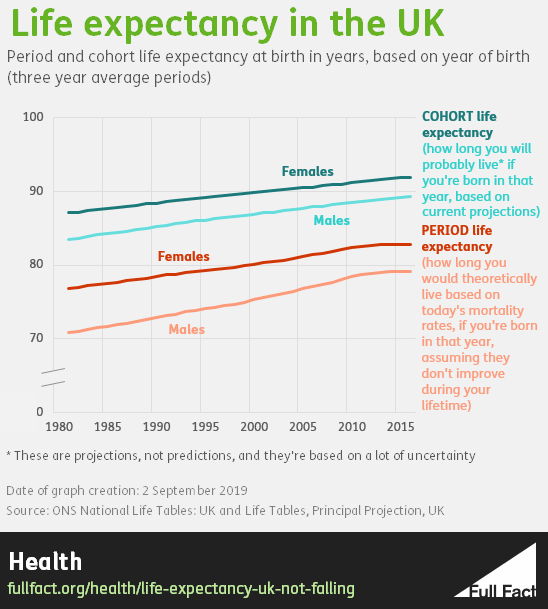
There are two ways of measuring life expectancy: called “cohort” and “period”.
Cohort life expectancy tries to project how long you will live by observing current mortality rates and projecting how those rates will improve over time. It’s regarded as the most realistic number for how long you’re actually expected to live.
Current cohort projections suggest a man born in the UK today has a life expectancy of nearly 90 years, while a woman’s life expectancy would be over 94 years.
A less tangible but still useful figure is period life expectancy. This just looks at the year you’re born in and assumes that year’s mortality rates apply throughout your life. So it’s a lower number because it’s not taking into account the likelihood that your life expectancy will go up as you get older, because in general we’re getting healthier, medicine is getting more sophisticated, and we’re living longer as a population.
But it has the advantage of being a more certain figure (it doesn’t have to guess what the future holds) and it tells us a bit more about what’s happening to people’s health and wellbeing right now. These are the figures featured by the New York Times.
On this measure, according to the ONS: “Life expectancy at birth in the UK did not improve in 2015 to 2017 and remained at 79.2 years for males and 82.9 years for females.”
If you look at the trend over time in those figures, both male and female life expectancies rose slowly until about 2014, and they haven’t discernibly changed since.
Areas like Hartlepool have seen falling life expectancy
In this section we’ll use “period” life expectancy figures, as these are better for showing us what’s happening to the UK today.
Different parts of the UK have seen different trends which don’t follow the national picture. For example, life expectancy at birth fell slightly for both sexes in the most recent figures for Scotland and Wales, and for men in Northern Ireland.
As the New York Times focuses on, Hartlepool has also seen falls.
Hartlepool has seen the steepest fall in male life expectancy of any local authority in the UK over roughly the last three years. It was 77.6 years around 2012-2014 and was 76.1 years in 2015-2017. For women the drop is much less pronounced: it was 81.6 in 2012-2014 and 81.4 in 2015-2017.
Even those figures are for Hartlepool overall, and there’s further evidence that neighbourhoods within the town differ a great deal. According to data from Public Health England, the gap in life expectancy between the most and least deprived areas of the town is 11.7 years for men and 10.2 years for women.
In one sense these falls don’t sound very big—but any fall in life expectancy is fairly unprecedented in the wider context of UK trends for over a century, and the stalls or falls in recent years have prompteddebate over what’s causing them.
Fact checking claims made by politicians, public figures and viral online content can give you the full picture backed by the evidence.
Subscribe to weekly email newsletters from Full Fact for updates on politics, immigration, health and more.
Our fact checks are free to read but not to produce, so you will also get occasional emails about fundraising
and other ways you can help. You can unsubscribe at any time. For more information about how we use your data
see our Privacy Policy.