Next round's on the NHS! Is the state picking up the tab for middle-aged alcoholics?
This article has now been updated. (Please see below.)
"Middle aged drinkers cost the NHS more than ten times as much as younger "binge" drinkers"
"The 55-74 age band imposes a greater burden on the state through drinking than any other age group"
Join 73,000 newsletter subscribers who trust us to check the facts
Sign up to get weekly updates on politics, immigration, health and more.
Subscribe to weekly email newsletters from Full Fact for updates on politics, immigration, health and more. Our fact checks are free to read but not to produce, so you will also get occasional emails about fundraising and other ways you can help. You can unsubscribe at any time. For more information about how we use your data see our Privacy Policy.
The Daily Mail, October 12 2012
It's drunken youths who usually make the headlines. Successive governments have argued that it's all too easy for teenagers to purchase cheap alcohol and lay waste to our city centres. But who costs the taxpayer the most money - the 18 year old admitted to A and E at 4am, or the retiree who's partial to a half a bottle of wine every evening?
The Times and the Daily Mail are reporting that alcohol abuse among those aged 55-74 is costing the NHS more than ten times what it pays out to deal with those aged 16-24. The newspapers cite the charity Alcohol Concern as the source for their articles.
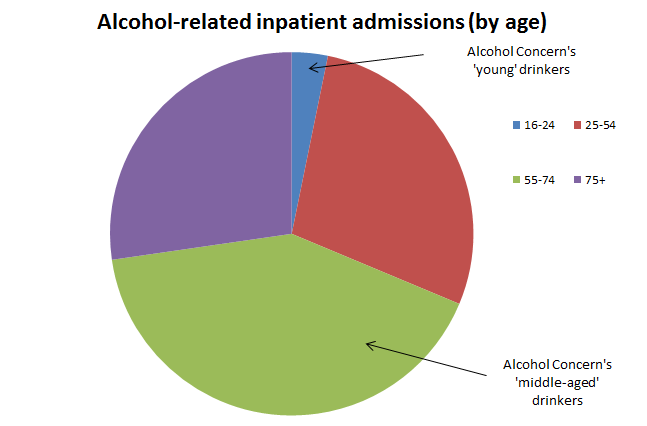
According to Alcohol Concern's latest research, statistics from 2010-11 show that "The cost of alcohol-related inpatient admissions in England for 55-74 year olds was £825.6 million compared to £63.8 million for 16-24 year olds".
From the pie chart below, which is based on data that's available on the charity's website, we can see how the cost of alcohol-related inpatient admissions is distributed amongst different age groups. Young drinkers impose the smallest financial burden, but the expense is fairly evenly shared between the other older age groups. So although we can compare young drinkers with "middle-aged" drinkers, young drinkers also weigh in at a fraction of the cost of any of the other age groups.
So you have to ask why the particular comparison between the young and middle-aged has been made? What's more, it seems odd to classify 55-74 year olds as "middle-aged". Why is a 54 year old not middle-aged but a 73 year old is?
What's the basis for Alcohol Concern's cost estimates?
Alcohol Concern has not yet explained how it collated the data that's embedded in its website. However, its numbers don't correspond with those published by the NHS Information Centre.
According to the latest government figures, alcohol is estimated to cost the NHS some £2.7 billion each year. But according to Alcohol Concern, in 2010/11 alcohol-related inpatient admissions generated a bill of £3.2 billion. This means we've already breached the £2.7 billion threshold before we take into account the price of A and E treatment, GP services and prescription costs.
It looks like Alcohol Concern is dealing with a different set of numbers, yet the £2.7 billion figure is quoted on the charity's website. Ultimately, it's not easy for us to trust the data until we've seen Alcohol Concern's evidence.
As we know that the NHS collects data on alcohol-related admissions, in theory it should be possible to produce estimates of how much alcohol abuse costs the health service and how the expense is distributed between different groups.
To help us figure out an answer to this question, here's what we need to look into:
1. How do we count the number of alcohol-related admissions?
2. How do we know that a health condition is "alcohol-related"?
3. How do we calculate the cost of different alcohol-related admissions?
1. How do we count the number of alcohol-related admissions?
When it comes to calculating the number of alcohol-related admissions, the North West Public Health Observatory (NWPHO) analyses Hospital Episode Statistics on behalf of the NHS. This is a data set that provides information on hospitals and their patients.
From NWPHO research, we can see that England's hospitals handled 1.15 million alcohol-related admissions in 2010/11. This equates to an average rate of 1,895 admissions per 100,000 members of the population. It's important to note that we're talking about the number of admissions, not the number of people admitted to hospital. So one person might be responsible for 20 admissions.
2. How do we know that a health condition is "alcohol-related"?
The NWPHO examines data for a range of diseases and injuries where alcohol might have played a role in a hospital admission. For every disease or injury, it estimates the proportion of cases that are attributable to alcohol consumption.
Each patient's disease or injury is accorded a score (from 0.0 to 1.0) and this helps us to see whether a particular condition might be "wholly" or "partially" attributable to alcohol. These scores are referred to as "Alcohol Attributable Fractions".
For instance, alcohol gastritis earns a 1.0 score as it's a condition that's "wholly" attributable to alcohol, wheras a case of assault receives a "partial" 0.27 score (alcohol is responsible for the hospital admission in 27% of cases).
What's more, the score of an injury or disease may vary depending upon the age and gender of a patient. In theory, if a 16-24 year old female is admitted for self-harm, she's almost twice as likely to have been under the influence of alcohol than an elderly man aged 75 or over admitted to hospital for the same reason (a score of 0.35 compared to 0.20).
3. How do we calculate the cost of different alcohol-related admissions?
Every year the NHS publishes a costing manual. This means that for every type of hospital episode, there's a specific price tag.
The Daily Mail and The Times have emphasised the statistics for inpatient admissions. It's worth noting that inpatient admissions account for less than half of the total NHS bill (according to Department of Health figures). Also, someone in need of inpatient treatment might be more likely to be suffering from the types of chronic health condition that result from long-term over-indulgence. We would therefore expect this patient to be older.
However, if we were to look at a different set of hospital statistics - for example, A and E admissions - we might discover that those aged 16-24 are a greater burden on the state.
On its website the charity states that it used Hospital Episode Statistics (HES) and Alcohol Attributable Fractions to calculate the number of alcohol-related admissions for each age cohort. Alcohol Attributable Fractions are age-specific so we know that a model exists to make comparisons across age groups.
However, the data that's publicly available is not organised consistently by age. Some data sets include statistics for those aged 0-44 years, while other data sets provide a more detailed breakdown for the same age range, providing numbers for those aged 0-17, 18-29 and 30-49 years. This means it's difficult to make direct comparisons.
It may be that Alcohol Concern has requested bespoke statistics from the NHS Information Centre.
Do the newspapers have their facts straight?
We need Alcohol Concern to explain how it compiled the data for its report. This is particularly important in the light of the fact that it's produced numbers at variance from official statistics.
Alcohol Concern is referring specifically to inpatient admissions when it calculates that "middle-aged" alcohol abuse runs up a cost that is ten times that generated by younger drinkers. However, both The Times and the Daily Mail have generalised about how much alcohol abuse amongst different age groups "cost(s) the NHS".
It's not obvious that the newspaper journalists have made this distinction, although it would be fair to say that the charity's press release doesn't emphasise it. We've suggested how Alcohol Concern might have compiled its inpatient admission statistics, and we've pointed out the risks of focusing on one area of expense without putting it in some kind of context. For instance, we still don't know how A and E admissions compare. Here we might expect young people's drinking habits to be exerting a greater strain on NHS resources.
It's unclear why Alcohol Concern has not released age-specific statistics for other types of hospital admission. In addition, the way that the charity has packaged its report appears to have prompted journalists to draw certain conclusions that don't reflect the limited data that the charity has published.
UPDATE (9 November 2012)
Since Full Fact published this article, we've been in conversation with Alcohol Concern about the data that underpins its report.
The charity has clarified that its figures are based on Hospital Episode Statistics. Although "summary data" is published online, the NHS Information Centre has confirmed that "only authorised users have access to the underlying data set".
Alcohol Concern has produced its numbers from this more detailed data-set. The charity has been able to apply alcohol-attributable fractions to every type of hospital admission, analysing primary and secondary diagnosis fields. (The primary diagnosis explains the cause of your stay in hospital; the secondary diagnosis is a record of any other underlying health problems.) If we look at the open-access "summary" tables, we find that only primary diagnosis codes are logged.
The more detailed data-set also provides information on patients by single year of age. This means that it's possible for Alcohol Concern to produce age-specific statistics. As for its definition of "middle-aged" drinkers (55-74 year olds), the charity offered the following response:
"In 2010, ONS data showed that alcohol-related death rates were highest for those aged 55-74. It followed that Alcohol Concern wanted to further investigate this.
Alcohol Concern also sought to understand the alcohol harm and cost associated with the 'working age' population, as defined by the OECD as 25 -54."
Alcohol Concern posits that the bill for alcohol-related inpatient admissions in 2010/11 amounted to £3.2 billion. However, as we pointed out, the government has previously estimated that alcohol costs the NHS £2.7 billion per year overall. (Around the time that we published our article, the government revised this 2007 calculation to around £3.5 billion per year.)
The charity says that it has generated its own estimate for alcohol-related inpatient admissions by calculating the cost of each admission: "the tariff applying to each admission was estimated using the HES-produced Resource Group (HRG) code, method of admission and spell duration, alongside the national tariffs for 2010/11".
Although we haven't seen the data that Alcohol Concern has produced and we're unable to direct our readers to the original source as it's behind a pay-wall (the NHS Information Centre require a fee to cover their costs), we're pleased to update our article with this additional information.
Flickr image courtesy of deepwarren.