Testing: Where are we?
The issue of Covid-19 testing has hit the headlines again in recent days, with reports both of tests not being available in certain areas of the country, and of an increase in how long it is taking to process certain tests.
Back in spring and early summer testing was of huge interest, as the government tried to ramp up the number of tests significantly, and set target after target, some of which it missed, some of which it met, and some of which it claimed to meet based on some questionable assertions.
Over July and August, as the severity of the outbreak receded, interest in the overall level of testing was replaced with concern about the effectiveness of the test and trace programme specifically and the speed of testing.
But in recent weeks, as case numbers have begun to increase again, and with schools universities and workplaces all beginning to open up, testing has once again become a major topic.
This article takes a look at how testing is working at the moment.
Join 74,000 newsletter subscribers who trust us to check the facts
Sign up to get weekly updates on politics, immigration, health and more.
Subscribe to weekly email newsletters from Full Fact for updates on politics, immigration, health and more. Our fact checks are free to read but not to produce, so you will also get occasional emails about fundraising and other ways you can help. You can unsubscribe at any time. For more information about how we use your data see our Privacy Policy.
What is the testing programme?
To start it’s worth clarifying what the government’s overall testing programme looks like.
There are broadly two types of test. There are diagnostic tests which check whether someone currently has Covid-19. And there are antibody tests which check whether they have had Covid-19 in the past.
These tests are sorted into four testing “pillars”.
Pillar 1 tests are diagnostic tests done in Public Health England labs and hospitals for health and care workers and patients who are seriously ill. Specifically, they test for the prescence of the virus's genetic information using what's called PCR.
Pillar 2 tests are also diagnostic tests, but done by commercial partners for the wider population. These tests are done at regional test sites, mobile testing units, satellite test centres and via home tests. More details on the differences can be found here.
Antibody tests happen under pillar 3.
Pillar 4 comprises a mix of antibody and diagnostic tests for the purposes of national surveillance and for researchers to understand more about the spread of the disease. However, positive cases identified through these studies are also reallocated to pillar 1 and pillar 2.
How much are we testing?
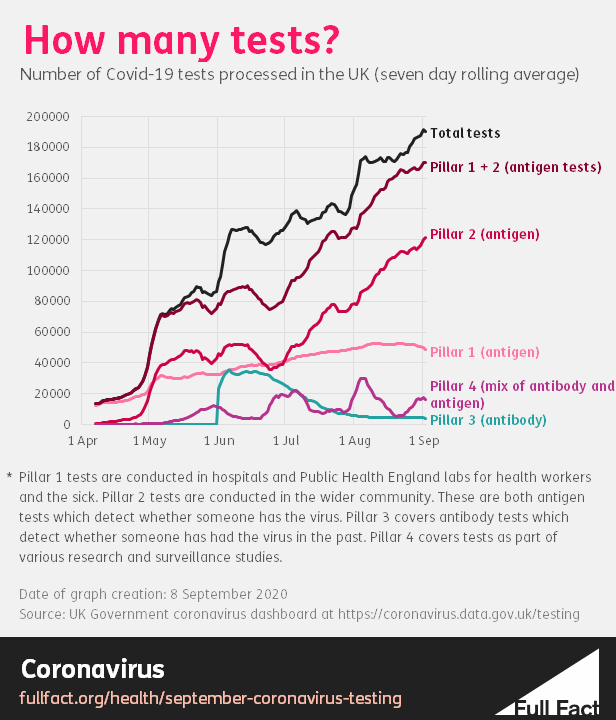
Overall, the number of diagnostic tests processed in the UK has increased and continues to increase to over 150,000 per day. It’s important to note that the number of tests doesn’t equal the number of people being tested, because people often receive more than one test.
On the other hand the number of antibody tests has fallen considerably and now averages fewer than 5,000 per day. This may be because antibody tests were made available to NHS staff at the end of May, which explains the spike in early June and steady tail-off, but were not made more widely available subsequently.
Currently, the level of diagnostic testing varies considerably across the four nations. Scotland is doing roughly 430 tests per 100,000 people, Northern Ireland 300, England 240 and Wales 170.
Scotland and Northern Ireland have been conducting a relatively stable number of pillar 1 tests throughout most of the pandemic. However, both countries started testing far more people through pillar 2 testing during August.
Meanwhile in Wales the total number of diagnostic tests actually fell over the past month, driven by a drop in pillar 1 tests.
The total number of daily tests in England increased over the past month. Pillar 1 tests have remained fairly stable while pillar 2 tests have increased somewhat.
Are we testing enough?
It's hard to say for sure whether the country as a whole is testing enough people, or whether the difference in the level of testing between UK nations means that testing is working better or worse in each country. One metric that can help is what’s called the positivity rate, which is the proportion of all tests conducted that come back positive.
Johns Hopkins University says this “is the most reliable way to determine if a government is testing enough.” If the positivity rate is too high, it suggests that the testing regime is likely to be missing some cases.
As explained by Professor of Statistics at Virginia Tech University, Ronald D. Fricker, Jr: “A good way to think about test positivity is to think about fishing with a net. If you catch a fish almost every time you send the net down – high test positivity - that tells you there are probably a lot of fish around that you haven’t caught – there are a lot of undetected cases. On the other hand, if you use a huge net – more testing – and only catch a fish every once in a while – low test positivity – you can be pretty sure that you’ve caught most of the fish in the area.”
The true positivity rate divides the number of positive tests by the total number of tests, but the government doesn’t publish the number of positive tests so we can’t calculate it. But we can use the number of people tested positive as a proxy to get a crude figure.
Using the number of diagnostic tests processed in the week to 2 September, and the number of people reported as testing positive over the same period, the crude positivity rate was 0.5% in Scotland, 0.8% in Wales, 0.9% in England and 1.2% in Northern Ireland.
To estimate the number of positive tests, we could look at the number of total tests per person tested. The number of people tested overall isn’t published anymore, but, as a snapshot, back on 1 May there were 122,347 tests on 73,191 people. So that’s around 1.7 tests per person tested.
So, assuming that the number of positive tests per person testing positive is around the same, you’d expect the true positivity rates to be around 1.7 times the figures above. But this is a very rough estimate.
The positivity rate isn’t a perfect way of determining whether a country is doing enough testing. While a lower positivity rate is theoretically better, it could also reflect poorer targeting or less accurate or rigorous testing.
For example, Public Health England currently recommends that labs test borderline positive cases a second time. If it didn’t do this, then the positivity rate could be lower, which at face value would be a good thing, but it would also mean that testing in general would be less accurate.
That aside, it appears that Scotland does have the most comprehensive testing programme, ahead of Wales and England, with Northern Ireland slightly behind them. However all four nations appear to have test positivity rates considerably below 5%. The World Health Organization (WHO) advised governments that before reopening, positivity rates should remain at 5% or lower for at least 14 days.
This measure can also be used to compare the UK’s performance to other countries. Overall, the UK is testing a large number of people relative to the size of its outbreak, compared to other countries. Our World in Data, a project run out of the University of Oxford calculates the UK’s positivity rate as 0.8%. This is on par with Germany, and lower than Spain, France and Italy. It is hard to compare countries very accurately because of the discrepancy between which submit data on the number of positive cases and which submit data on the number of people who have tested positive.
However, even if the UK’s positivity rate was double (assuming that every person who tested positive had done two Covid-19 tests, each of which came back positive), a rate of 1.6% would still put it among the lowest (i.e. best) rates in Europe.
How long does it take to process a test?
An important part of a testing regime is how quickly tests can be processed. Quicker turnaround times help make contact tracing more effective, and mean that people who do test positive self-isolate quickly.
The processing speed of pillar 1 tests is measured as the time between the lab receiving the sample and a result being issued. For pillar 2 tests it is the time between the person taking a test and the result being issued.
Data for England shows that 89% of pillar 1 tests are processed within 24 hours. This has remained stable since first published in mid July.
However the turnaround time for pillar 2 tests has increased since June.
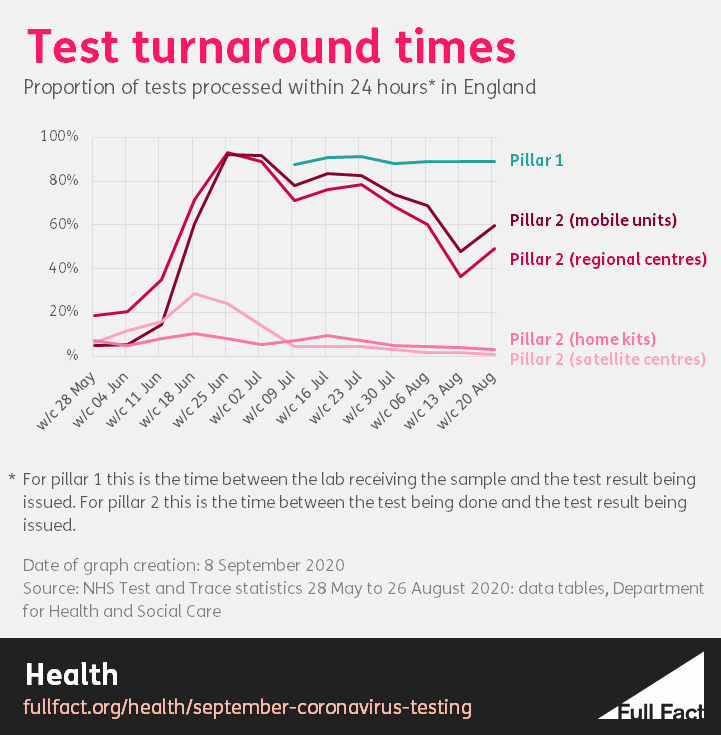
In late June the vast majority of tests at regional centres and mobile units in England were processed within 24 hours. Now the vast majority are only processed within 48 hours.
In mid June the vast majority (91%) of tests at satellite centres were processed in 48 hours. In the week starting 20 August just 8% were. The majority (51%) took more than 72 hours to process.
Home tests were being processed most quickly in the week of 16 July, when 74% were processed within 48 hours. That figure was 18% in the week of 20 August, with the majority (61%) taking more than 72 hours to process.
Data for Wales is more volatile but shows that tests at non-NHS laboratories from care homes and home tests have been taking longer to complete than before. However the turnaround speed at mobile units and regional centres has held up.
We have not been able to locate statistics on test turnaround times for Scotland or Northern Ireland.
As for why this is happening, government ministers and officials have made some comments on the recent problems accessing tests which could have had an impact on the speed at which tests are processed.
In recent days there have been various reports of people being unable to get a test or directed to test centres far away from where they live.
At the Health Select Committee, health secretary Matt Hancock said: “We’ve had a problem with a couple of contracts...
“It’s a matter of a couple of weeks until we can get all of that sorted.” Director of Testing at NHS Test and Trace in England, Sarah Jane-Marsh tweeted on 8 September: “Can I please offer my heartfelt apologies to anyone who cannot get a COVID test at present. All of our testing sites have capacity, which is why they don’t look overcrowded, it's our laboratory processing that is the critical pinch-point.”
This shows in the data. In recent weeks the gap between the number of tests done and the theoretical lab “capacity” for tests in pillars 1,2 and 4 has in general been narrowing.
However the number of tests has not reached or exceeded that theoretical capacity which raises the question of what “capacity” actually means. For the past few weeks the number of pillar 1 and pillar 2 tests processed has been at roughly 80% of theoretical capacity.
We wrote about this question back in July, when the government was claiming to have hit several targets due to increases in capacity figures. We wrote then: “there remains some uncertainty about how “capacity” is measured, and how meaningful it is if the system is never used at full capacity.”
At the time we asked the Department for Health and Social Care (DHSC) whether its definition of capacity reflected the whole system-wide capacity to conduct a test—including the availability of kits and staff at testing centres, for example—but did not receive a reply.
Targets
Finally it's worth noting that on 30 July, the Department of Health and Social Care (DHSC) published a new series of “ambitions” for the NHS Test and Trace service, two of which were due “by September.”
They were to “test 150,000 at-risk people without symptoms per day” and to “have 100,000 people participating in research studies into COVID-19 immunity”.
It’s unclear whether these ambitions were to be met by the beginning of September or by the end. Some of the other targets specify that they will be met by the “end of” a month, but not these two.
We can’t tell if the first target has been met yet, because data on the number of people tested across the UK isn’t currently published, only the number of tests done.
There have been, at most, 227,465 tests done on a single day (on 10 September).
As for the other target, it is unclear whether there are currently over 100,000 participating in research studies.
Over 100,000 people have definitely participated in research studies to date. For example, 109,075 people participated in the REACT-2 study which tested for Covid-19 antibodies between June and July.
You can read more on how the government performed against its previous targets here.
Update 14 September 2020
The first graph in this article has been updated to say it was made on 8 September 2020, not 2019.
Correction 16 November 2020
This piece initially referred to RNA PCR tests as antigen tests which is commonplace but not strictly accurate.