It’s a claim Jeremy Hunt has repeated across the campaign trail in his bid to become the next leader of the Conservative party and Prime Minister of the UK. Whether he’s launching his campaign, answering questions on ConservativeHome, writing in the Times, being interviewed on LBC or the BBC, it’s a figure used to show his track record as health secretary—a post he occupied from September 2012 to July 2018.
We spoke to the Care Quality Commission (CQC), England’s health and social care services watchdog, to ask them for more information. It confirmed to us that it had provided Mr Hunt’s office with the figure and that, according to its calculations, 2.7 million is the net increase in the number of people admitted to acute or specialist trusts in 2017/18 that have improved their CQC rating from either ‘inadequate’ or ‘requires improvement’ to ‘good’ or ‘outstanding’.
In that time 33 trusts have gone from inadequate or requires improvement to good or outstanding, while four have gone the other way. 46 trusts have stayed at good or outstanding, and 66 have stayed at inadequate or requires improvement. These figures may be affected by the CQC prioritising re-inspections for hospitals with lower ratings.
Since we originally wrote this article the Care Quality Commission has published the analysis it did for Mr Hunt, following correspondence with the Office for Statistics Regulation.
The CQC sent us the data it used to calculate these figures. It used figures from NHS Digital on the number of admissions to each hospital trust in England in 2017/18. This isn’t quite the same as the number of people admitted, as a person can be admitted to hospital more than once in the year and would be counted each time.
It then looked at how many NHS acute hospital trusts had improved their rating to good or outstanding between the time they were first rated (sometime after 2013 when this rating system was introduced) and March 2019.
It also looked at how many trusts’ ratings had deteriorated to requires improvement or inadequate in that time.
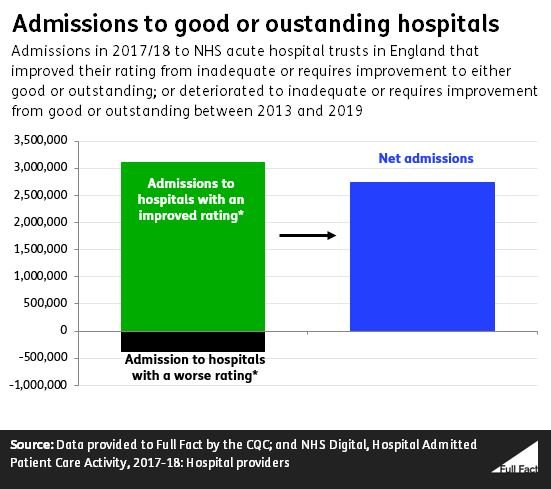
It then added up all the admissions to the improved hospital trusts in 2017/18 and all the admissions to the deteriorated trusts and subtracted one from the other. This produces a net figure for how many more admissions there were to trusts that had improved their rating in this time—just over 2.7 million.
Just over three million admissions were to hospital trusts with an improved rating (33 trusts) while around 370, 000 were to trusts with a deteriorating rating (four trusts). That’s just over 90,000 admissions on average per trust—no matter whether their rating went up or down.
So these figures don’t really tell us anything about what effect, if any, the changing rating of the hospital had on the number of admissions it received.
Of the trusts whose ratings stayed the same 46 remained at the good or outstanding level while 66 remained at the requires improvement or inadequate level.
Trusts with higher ratings are inspected less frequently
These figures may be partly affected by the CQC prioritising re-inspection for trusts that were rated as requires improvement or inadequate.
According to the data provided to us by the CQC, of the 99 trusts that were rated requires improvement or inadequate on their first inspection (between late 2013 and 2017), all but two had been fully re-inspected by March 2019. Of the 50 trusts that were rated good or outstanding on first inspection, 22 had not been fully re-inspected by then. (Some of these trusts have been fully inspected since March 2019, which is when the data behind the 2.7 million figure was extracted, with at least one trust being downgraded from good or outstanding to inadequate or requires improvement.)
So it’s possible that the system may be at least somewhat skewed towards identifying improvement (an issue that also affects Ofsted ratings for schools, something we have written about at length.) Given the number of improved trusts is greater than the number yet to be re-inspected, however, this effect cannot account for all the improvement.
These figures also only apply to the overall trust—individual hospitals and services within these trusts may have been re-inspected within the intervening time. The CQC also told us that it annually re-inspects trusts to see if they are ‘well-led’—one of the five key criteria in a full inspection. It told us how ‘well-led’ a trust is usually correlates to how performs on the other four criteria.
So although trusts might not have been fully re-inspected since, the CQC still monitors and inspects various aspects of them.
60% of NHS acute hospitals (rather than trusts) in England (or 1,054) were rated as ‘good’ in July 2018, and another 6% (or (105) as ‘outstanding’. Another 31% (or 545) were rated as ‘requires improvement and 3% (or 48 hospitals) were rated as ‘inadequate’.