Has there been a ‘Brexodus’ of EU citizens since the referendum?
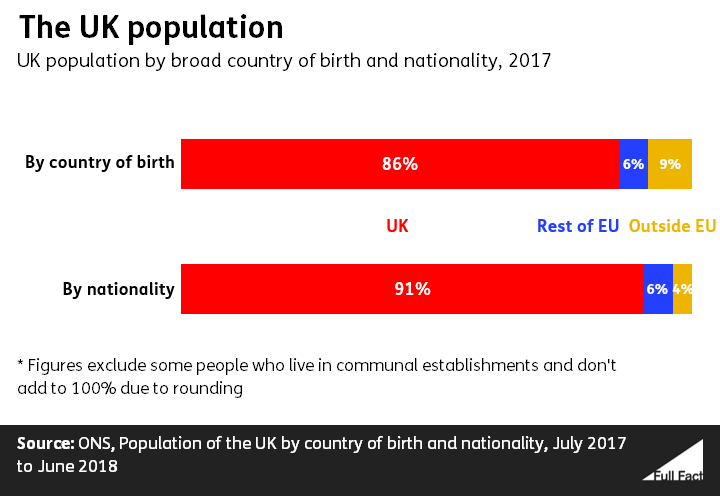
Around 3.7 million people living in the UK are citizens of another EU country. That’s about 6% of the UK population, according to the latest figures covering the year to June 2018.
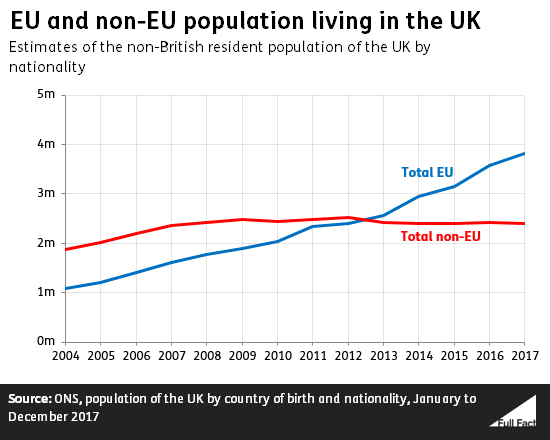
That compares to 3.4 million in the year before the EU referendum. Overall, the EU citizen population in the UK has gone up by an estimated 35,000 in the last 12 months, an increase of 1%. Between 2016 and 2017, the number increased by 240,000, an increase of 7%.
This may represent a slight slowing down in the rate of EU population growth, but the available figures aren’t completely clear. We know the population of other EU nationals in the UK increased by about 13% between 2015 and 2016, the last period we have data for before the EU referendum.
In any case, there’s little evidence yet that EU citizen population growth has changed trend since the referendum vote in 2016.
Join 72,547 people who trust us to check the facts
Subscribe to get weekly updates on politics, immigration, health and more.
EU net migration to the UK has fallen since the vote, but is still positive—more EU citizens are entering than leaving
In the year before the referendum, net migration of citizens of other EU countries was estimated at 189,000. In other words, many more EU citizens immigrated to the UK than emigrated from it.
In the year to June 2017, it fell to an estimated 103,000. In the year to June 2018 that fell to 74,000, the lowest estimate since 2012.
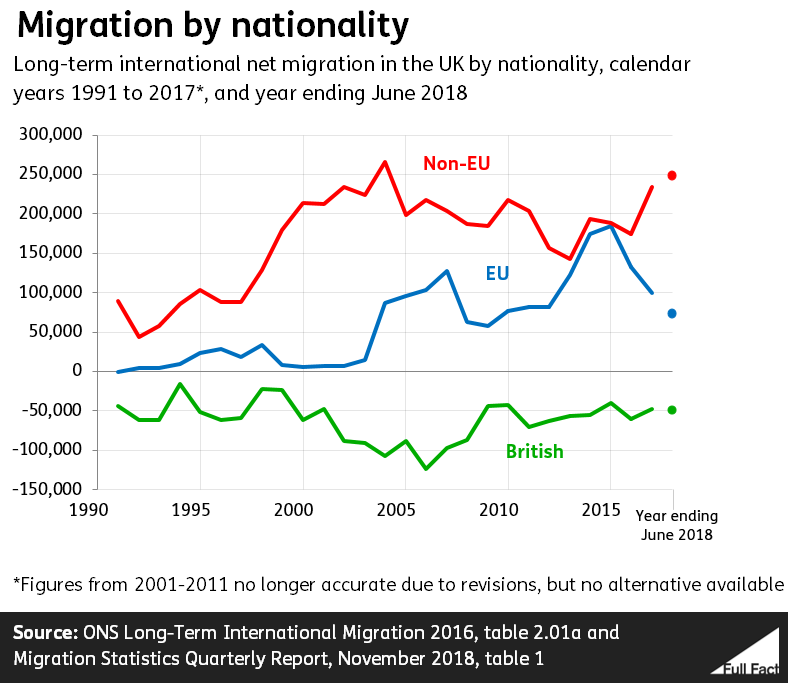
If you look specifically at EU citizens emigrating abroad, around 95,000 are thought to have emigrated in the year up to the referendum. 123,000 EU citizens emigrated from the UK in the year following it, and the latest figures show 145,000 did in the year to June 2018.
So both sets of figures show a marked cooling off in the EU immigration figures, although it remains the case that more come to the UK than leave.
There are ongoing concerns about the accuracy of these figures
All of the figures mentioned so far come from surveys, rather than physically counting people in and out of the country. This isn’t normally a problem—plenty of major and reliable statistics about the UK come from surveys, like employment estimates.
The problem with these is that the surveys relating to immigration and population don’t agree on what’s happening. Coupled with that, they don’t tell the same story that administrative data, such as the number of National Insurance numbers being issued to EU nationals, is telling.
One of these ‘disagreements’ becomes apparent when comparing the previous two charts—the non-EU population of the UK isn’t growing, but the net migration of non-EU citizens is positive each year. One recent estimate suggested that, over the past eight years, around half a million non-EU nationals are unaccounted for because of this difference, and a similar discrepancy in the opposite direction applies to EU nationals.
More recently, there’s evidence from work the ONS has done comparing its estimates to admin data from the Home Office that the passenger survey may be underestimating the number of people who emigrate abroad after coming to study in the UK:
“This [work] led us to conclude that the International Passenger Survey was likely to be underestimating former student emigration and we therefore concluded that any implied non-EU student net migration figure is likely to be an overestimate.”
It’s important to remember that different sources of data won’t always match exactly, even when they’re working as they should. For example, the population estimates exclude people living in communal establishments, whereas there’s no reason a passenger survey at an airport would.
But with all this in mind, the figures on net migration and particularly any figures on migration for study purposes should be treated with caution.
The number of EU workers in the UK has started to fall
There are around 2.2 million citizens of other EU countries in employment in the UK, using the latest figures for July to September 2018. That’s slightly lower it’s been since mid-2016. It also represents a change in the long-term trend.
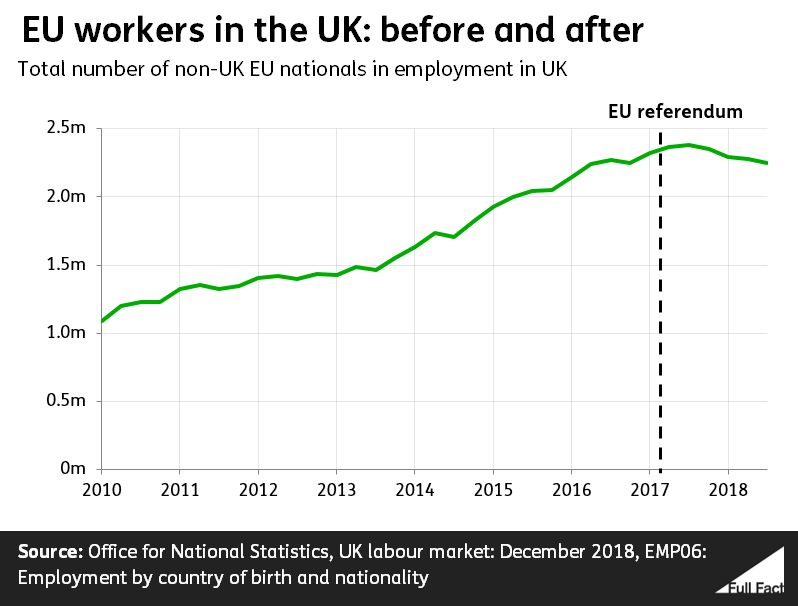
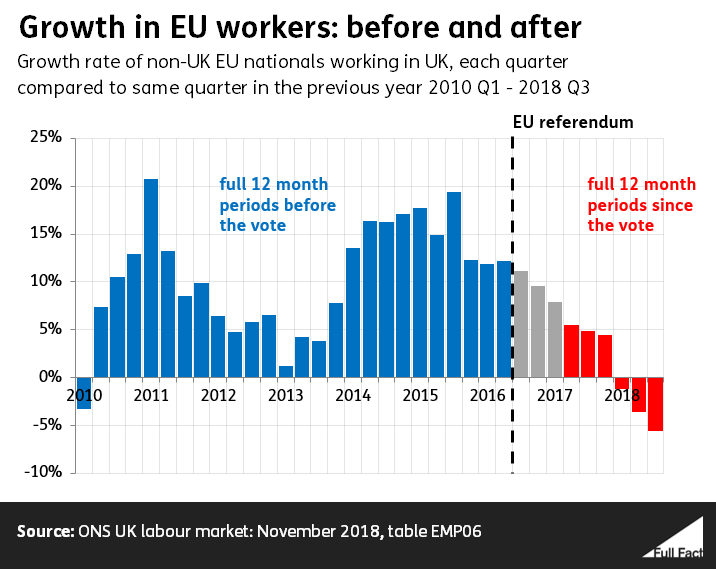
The number of EU citizens in work grew by 12% in the year leading up to the referendum, but it fell by 6% in the 12 months to September 2018.
One of the biggest changes is among workers of the ‘A8’ EU countries—mainly central European countries which joined the EU in 2004, like Poland and the Czech Republic. Figures suggest their numbers have started to fall.
This slowdown actually started before the referendum: worker growth in 2016 before the referendum was less than half what it was in 2015.
Citizens of other EU countries are more likely to be workers than ever before
Another change since the referendum vote is that EU citizens who are here are more likely to be in some kind of work.
The employment rates of EU citizens—in this case the proportion of people aged 16-64 who are in work—have generally risen across the board since the referendum. That includes citizens of the A8 central European countries, those from Romania and Bulgaria, and those of older EU member states like France and Germany. It also follows growth in the employment rate of UK citizens.
Overall, 83% of EU citizens in the UK of that age group are thought to be in work.
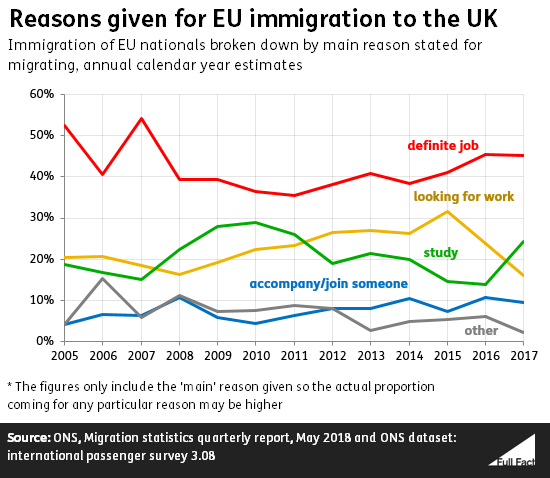
There are any number of reasons why this might be the case, but a good theory is that fewer citizens of other EU countries are immigrating to the UK without a job in the first place.
Immigration estimates suggest that as well. 18% of EU immigration currently say their main reason for coming is because they’re looking for work and don’t have a job lined up. That’s a very low rate compared to previous years—in the year to June 2016 over a quarter of immigrants were estimated to have come looking for work.
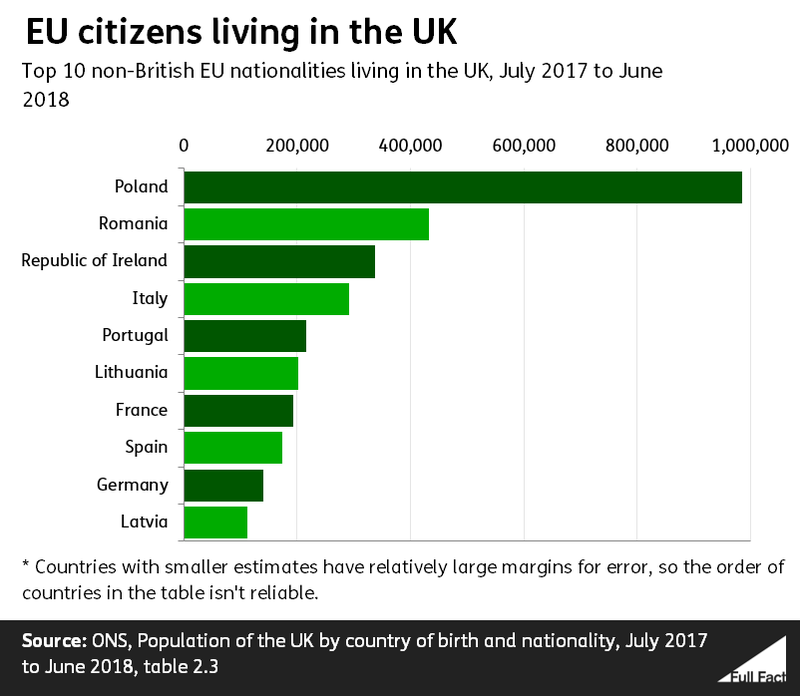
Polish citizens make up the bulk of non-British EU citizens living in the UK
Of the 3.7 million EU citizens living in the UK, it’s estimated that just under one million are Polish nationals, the largest single nationality from the rest of the EU. They’re followed by an estimated 433,000 Romanians and 337,000 Irish nationals.
These figures aren’t certain: they’re based on a survey of households and that means there’s a margin for error for the figure for each nationality. Polish, Romanian and Irish citizens are clearly the most numerous, but further down the list, the ‘rank order’ of nationalities isn’t reliable.