How immigrants affect public finances
- The net fiscal impact of immigration is the difference between the taxes and other contributions immigrants make to public finances, and the costs of the benefits and public services they receive.
- There is no single "correct" estimate of this impact. Results of existing studies all depend on the methodology and the assumptions researchers must make (for example, about whether to include the costs of educating UK-born children of immigrants).
- Most studies suggest that the fiscal impact of immigration in the UK is relatively small (amounting to less than 1% of the country's overall Gross Domestic Product).
- The fiscal impact overall depends on the characteristics of individual immigrants and what they do in the UK. Immigrants who are young, skilled and working in highly-paid jobs are likely to make a more positive net fiscal contribution than those working in low-wage jobs with large families.
- Researchers generally agree that immigrants from the European Economic Area (EEA) and recent immigrants are, as groups, more likely to have a positive net fiscal impact / less likely to have a negative net fiscal impact but estimates suggest that there are also considerable country-by-country differences.
- The net fiscal impact of immigration has been slightly better in the UK than in some other wealthy countries, according to international studies.
Join 74,000 newsletter subscribers who trust us to check the facts
Sign up to get weekly updates on politics, immigration, health and more.
Subscribe to weekly email newsletters from Full Fact for updates on politics, immigration, health and more. Our fact checks are free to read but not to produce, so you will also get occasional emails about fundraising and other ways you can help. You can unsubscribe at any time. For more information about how we use your data see our Privacy Policy.
There is no single "correct" answer to the question of how much immigrants contribute to public finances
The net fiscal impact of immigration is the difference between the taxes and other contributions migrants make to public finances, and the costs of the benefits and public services they receive.
Establishing the fiscal impact of immigration is a challenge both in theory and in practice. Not everyone agrees on how to calculate it, which makes it difficult to make strong claims about the exact size of the fiscal impact of immigration. In particular, assumptions need to be made about:
- How immigration affects the costs of providing public services.
- Conceptual matters include things like what costs to attribute to immigrants, such as the costs of educating the UK-born children of immigrants, or the cost of things like defence spending that do not necessarily depend on the size of the immigrant population.
- Practical matters include things like data limitations – for example estimates of taxes paid depend on earnings, but there are no statistics on what immigrants earn if they are self-employed, nor on the number or earnings of seasonal workers.
- Whether to take a snapshot of the fiscal impact in a given year or period based on historical data (the "static approach"), or attempt to consider impacts over immigrants' entire lifetimes (the “dynamic” approach).
Most studies have found that the positive or negative fiscal impact of migration is less than 1% of Gross Domestic Product (GDP)
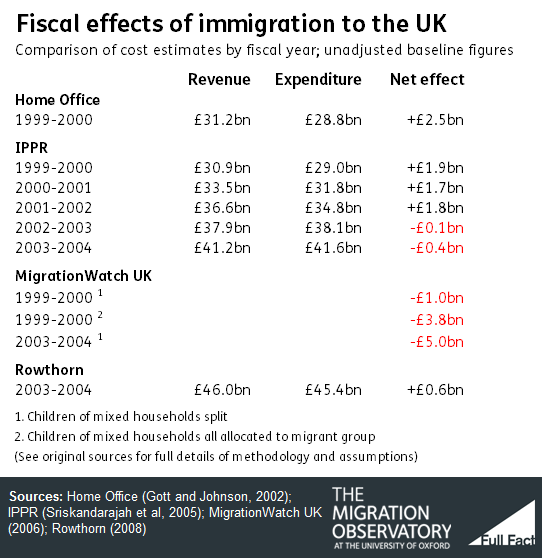
Attempts at quantifying the fiscal impact of immigration in the UK started in the late 1990s with a Home Office report. The report found that for the fiscal year 1999-2000 (that is, April 1999 to March 2000) UK immigrants contributed £31.2 billion in taxes and used benefits and state services valued at £28.8 billion. In other words, the net fiscal contribution of immigrants, taken together, was approximately +£2.5 billion in 1999-2000.
A report from the Institute for Public Policy Research (IPPR) in 2005 found that both revenues from and expenditure on immigrants grew between 1999-2000 and 2003-2004. Expenditure attributed to immigrants grew by more than the revenue from them, resulting in a negative impact of -£0.4 billion in 2003-4.
The UK born population also had a negative fiscal impact. This is because the UK was running a budget deficit in 2002-2003 and 2003-2004. The study, however, found that impact from immigrants was less than the impact of the UK born population in that year.
A 2008 study by the University of Cambridge economist, Robert Rowthorn, calculated that the immigrant population’s contribution in 2003-4 would have been about +£0.6 billion if the UK had been running a balanced budget. This study also adjusted for how costs are attributed to immigrants.
A 2006 report by Migration Watch UK challenged previous studies' decision to assign the cost of services for children born to one immigrant and one UK-born parent to the UK-born group, and argued towards splitting this spending in equal parts between the UK-born and foreign-born groups.
The resulting estimates suggested that the net fiscal impact of immigrants was negative (-£1 billion for 1999-2000 and -£5 billion for 2003-2004). Alternative estimates allocating all children of mixed couples to the immigrant group show the fiscal cost of migrants to be much higher (around -£3.8 billion in 1999-2000).
Estimated fiscal impacts of European Economic Area (EEA) migrants and of recent migrants are more positive than those of non-EEA and longer-established migrants
EEA/non-EEA: More recent studies have tried to estimate the impact of groups from different parts of the world and over longer periods of time rather than single years. These have found that the net fiscal impact of European immigrants overall is more likely to be positive, while that of non-European migrants overall is more likely to be negative. However, that’s not necessarily true for every country or every individual within each group, because people’s characteristics—from age to occupation—affect what their contribution to the public purse is.
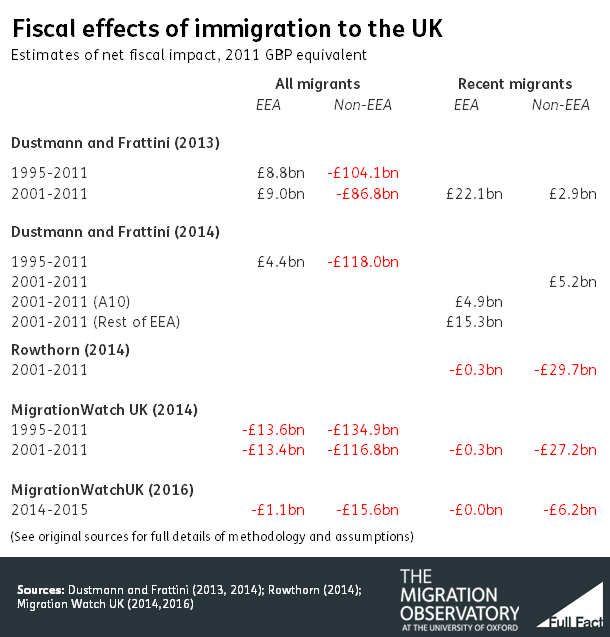
A study from University College London (UCL) in 2014 (following a discussion paper in 2013), came to this conclusion.
Their main results estimated that during the years 1995-2011 the total fiscal impact of EEA migrants in the UK was about +£4.4 billion (an annual average of close to +£0.3 billion per year).
On the other hand, the total fiscal impact of non-EEA migrants for this period was estimated at -£118 billion (an annual average of close to -£6.9billion). The corresponding value for the UK-born population during the same period was a net fiscal cost of -£591 billion, meaning that over the whole period there wasn’t a big difference between the contributions of immigrants and the UK-born population on a per capita basis.
Recent immigrants: The UCL report found that although there had been a fiscal cost of immigration overall, recent immigrants (who arrived since 2000) had made much greater fiscal contributions than longer-established immigrants.
It estimated net fiscal impacts of +£5 billion for recent immigrants from the ten countries that joined the EU in 2004 (A10 countries) and +£15.3 billion for other recent EEA migrants (EU14 countries). The study also found that while A10 migrants worked mostly in lower wage occupations, they were also more likely to be employed, offsetting the impact of their lower wages.
Recent non-EEA migrants had an estimated impact of +£5.2 billion. However, the contribution of each group fluctuated over the period.
Varying estimates of recent/non-recent and of EEA/non-EEA migrants
Using a different set of assumptions, a MigrationWatch UK study found that all four groups of immigrants (EEA, non-EEA, recent EEA and recent non-EEA) had negative fiscal impacts during the 1995-2011 period. It was consistent with the UCL study, however, in finding that recent and EEA migrants made a more positive contribution than non-recent and non-EEA migrants.
Commenting on the UCL study, Robert Rowthorn argued that the estimates understated the fiscal cost of immigration because they did not account for evidence that immigration may displace British workers. Accounting for this and making other adjustments, he found a negative impact of recent EEA migration of about £0.3 billion and a negative impact of recent non-EEA migration of £29.7 billion.
In 2016, Migration Watch UK issued a paper estimating the fiscal impact of immigration for the year 2014/15. This found a fiscal cost overall, and had similar results as the later years in the UCL study, with a positive contribution only from recent EU14 migrants and a fiscal cost from all other groups.
As the UK had a large budget deficit in that year, the UK-born population was a fiscal cost overall as well. However, the UK-born working-age population did make a positive fiscal contribution that was only turned into a deficit overall by the costs of the elderly. In contrast, the immigrant working-age population made a negative fiscal contribution overall.
The research findings are broadly in line with newly-released official data
All of the estimates above are based on survey data to estimate the tax contribution made by migrants and the cost of benefits paid to them. However, over the past year, the government has published some data derived from HMRC and DWP records of amounts actually paid and received.
These estimates are not fully comparable with the studies discussed above because they do not include the cost of providing public services to immigrants.
HMRC released a report in May 2016, which said that recently arrived EEA nationals –those who arrived within the previous 4 years – received £0.56 billion in tax credits and Child Benefit in the 2013/14 fiscal year but paid £3.11 billion in income taxes and national insurance contributions.
But this doesn’t represent the total ‘net fiscal contribution’ and isn’t comparable with the studies discussed above. These immigrants will have paid other taxes like VAT and Council Tax, they will also have received other benefits like Housing Benefit and JSA, and they will have used a range of public services too.
The DWP released a report in February 2016 showing that Housing Benefit of £1.28 billion was paid to EEA national-led claims in the same year 2013/14 (regardless of when they arrived in the UK).
Finally, HMRC released a much more detailed report published in August 2016 that provided a country by country breakdown of income tax and National Insurance payments and spending on tax credits and Child Benefit for most EEA countries in 2013/14.
This showed that immigrants from some countries paid much more than the average taxpayer but that immigrants from some other countries paid much less.
This suggests that the survey-based research is probably correct to estimate that —as a group—immigrants from the EU14 countries made a much more positive annual fiscal contribution than those—as a group—from the A10 countries that joined the EU in 2004 and later. No matching information has been published for immigrants from other countries.
The long-term fiscal impacts of immigration
In 2013 the Office for Budget Responsibility (OBR) examined how the long-term fiscal sustainability of the UK might change over a 50-year period, depending on the level of immigration to the country while maintaining the same fertility rate across immigrants and the UK born population.
Unlike the studies discussed above, the long-term estimates include the fiscal impact of anticipated future immigration flows, as well as that of immigrants who are already in the country; they also implicitly account for the impacts of immigrants' children once they enter the workforce. The Office for Budget Responsibility (OBR) found that:
- Higher net immigration would reduce pressure on government debt over a 50-year period (based on OBR projections, the high net-migration variant.)
- This result was driven by the fact that incoming migrants are more likely to be of working age than the population in general and the assumption that, on average, they make the same fiscal and economic contribution as anyone else of the same age and gender. The OBR, however, noted that over an even longer time horizon than 50 years, these immigrants would also retire and add to age-related spending pressures.
- It concluded that "higher migration could be seen as delaying some of the fiscal challenges of an ageing population rather than a way of resolving them permanently".
Cross-country evidence on short-term impacts
The OECD estimated the short-term fiscal impact of immigration in a number of countries. Its calculations for the years 2007-2009 suggested that:
- The fiscal impact of immigration in the UK (which the OECD put at +0.46% of GDP) was more positive than the average fiscal impact of immigration across the countries studied (+0.35% of GDP). The UK’s impact was greater than those in 16 of the other countries, including Germany, France, Canada and Australia.
- The fiscal impact of immigration was more positive in 10 countries than that in the UK. These countries included Switzerland, Belgium, Spain and Portugal.
- The OECD country with the most positive fiscal impact from migration was Luxembourg (+2% of GDP), while the country with the most negative estimated fiscal impact from migration was Germany (-1% of GDP).
- These differences were explained by several factors, according to the report's authors. Employment (that is, whether or not immigrants found work) was the most important. The reason for migration (e.g. whether migrants come for work, family, or other reasons) and immigrants' age at arrival also played a role, with younger migrants contributing more over the course of their life cycles.
More information
- Migration Observatory's detailed analysis.
This briefing was written by Yvonni Markaki and Carlos Vargas-Silva in collaboration with Full Fact. Thanks to Michael O'Connor and Robert Rowthorn for helpful comments and suggestions on an earlier version of this work. This work has been funded by the Nuffield Foundation but the content is the responsibility of the authors and of Full Fact, and not of the Nuffield Foundation.