BBC Question Time, factchecked
Join 73,000 newsletter subscribers who trust us to check the facts
Sign up to get weekly updates on politics, immigration, health and more.
Subscribe to weekly email newsletters from Full Fact for updates on politics, immigration, health and more. Our fact checks are free to read but not to produce, so you will also get occasional emails about fundraising and other ways you can help. You can unsubscribe at any time. For more information about how we use your data see our Privacy Policy.
“I'll tell you where the money should come from, the money should come from tax avoidance and tax evasion. The super-rich and the corporate elite who rob from the Treasury £40 billion a year.”
Len McCluskey, 30 March 2017
HM Revenue & Customs thinks it lost about £7.4 billion to tax evasion and avoidance in 2014/15, less than a quarter of the figure quoted by Mr McClusky.
Its best estimate for the overall tax gap was £36 billion. We’ve asked Unite if that was the basis for Mr McClusky’s claim.
The tax gap is the difference between what HMRC collects and what it thinks it’s owed in theory.
The overall tax gap includes things other than evasion and avoidance. It counts an estimated £4.8 billion lost to criminal activity (such as smuggling), £6.2 billion uncollected from the hidden economy (which includes things like undeclared cash-in-hand jobs), or £3.2 billion in honest mistakes.
Arguably, it’s fair to use “tax evasion and avoidance” as shorthand for all these activities when the phrase “tax gap” might be met with blank faces.
But HMRC’s estimates don’t justify the claim that all £40 billion of these losses came from “the super rich and corporate elite”.
Only £9.5 billion was lost to large non-illegal businesses, according to HMRC. Another £3.4 billion was lost to individuals, not all of whom will be “super-rich”. It estimates that half the tax gap was down to small and medium sized businesses.
HMRC doesn’t know exactly how much tax it’s missing out on each year. Some parts of the estimate come with a lot of uncertainty and “an element of judgement is used”, as HMRC puts it.
For example, HMRC thinks it may have lost anywhere between £300 million and £1.4 billion in cigarette taxes last year. That’s quite a big range of possibility.
HMRC’s also aren’t the only estimates. The academic Richard Murphy thinks its figure is a very big underestimate, and questions the way it categorises some activities.
“‘We are clear about what we want from Europe. We say yes to the single market.’ That was the manifesto that your prime minister and you stood on in the last election… It’s in the Tory party manifesto.”
Lisa Nandy MP, 30 March 2017
“People voted to leave the European Union, they knew they were voting to leave the single market… Even in the leaflet that the government sent to every single household at the cost of £9 million to the taxpayer, it said quite clearly, leaving the European Union means leaving the single market.”
Paul Nuttall MEP, 30 March 2017
The Conservative Party manifesto for the 2015 general election did say “We are clear about what we want from Europe. We say: yes to the Single Market.”
There are other positive references to the single market in the document. For example, it says, “We benefit from the Single Market… we will not let the integration of the Eurozone jeopardise the integrity of the Single Market”.
The manifesto also promises a referendum on EU membership, although staying in the EU and leaving its single market can be two different things.
Norway, Iceland and Liechtenstein are part of the European Economic Area, making them members of the single market. They’re not EU members, although they do accept many EU laws as part of this arrangement, including (except for Liechtenstein) those on free movement of people.
The EU referendum leaflet sent around by the government, arguing the case for staying in the EU, is less clear than the manifesto.
It doesn’t explicitly say that leaving the EU means leaving the single market. It does hint at the likelihood of reduced “access” to the single market if the UK left the EU.
For example, the document argues that “remaining inside the EU guarantees our full access to its single market. By contrast, leaving creates uncertainty and risk.”
The leaflet also states that “losing our full access to the EU’s single market would make exporting to Europe harder and increase costs.”
And it compares the UK situation post-Brexit vote to other countries outside the single market. “A more limited trade deal with the EU would give the UK less access to the single market than we have now… For example, Canada’s deal with the EU will give limited access for services, it has so far been seven years in the making and is still not in force.”
“Another part of the problem that we've got is that Labour decided to sign us up to these crazy PFI deals so for every pound out of every ten that goes into the NHS is going to pay off the debt that you guys saddled us with.”
Paul Nuttall MEP, 30 March 2017
This isn’t correct according to the latest cost estimates for Private Finance Initiatives (PFIs) to the NHS in England. These suggest ongoing PFI payments cost the equivalent of around 2% of the NHS budget, or one pound in every £55.
We don’t yet know where Mr Nuttall’s figures come from, and we’re trying to get in touch.
What are PFIs?
PFIs are a kind of procurement where the private sector manages the delivery of public sector projects. This typically involves designing, building, financing and operating a government facility or service, like a hospital. The private sector owns the assets and leases them to the government.
It’s different from most public sector projects where the government owns the assets and does most of these things itself, although private contractors are often still used to deliver some services and the end of the process.
PFIs are paid for upfront by groups of private investors, who take on the risks of construction. The government pays later, in the form of annual payments called “unitary charges”. These cover the costs of the services being delivered, plus the costs of interest and repayment of the debt.
PFIs have provoked a lot of controversy since their introduction in the early 1990s. The House of Commons Library has outlined some of the general arguments for and against them.
£2 billion annual cost of PFIs to the NHS
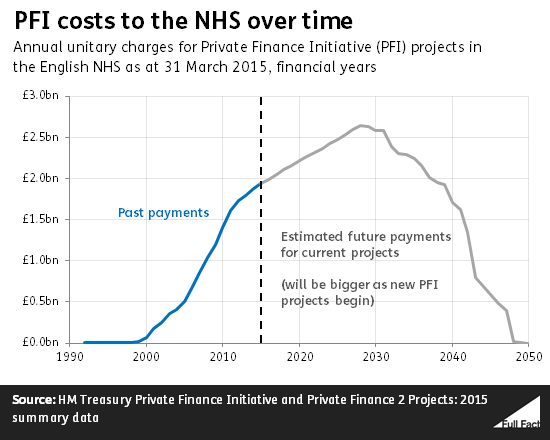
In 2016/17 the NHS in England paid an estimated £2 billion for past and current PFI projects. That’s about 2% of the NHS England budget of about £108 billion and a similar proportion of total Department of Health spending, of about £120 billion.
The latest figures, as of 2015, show the department is currently paying for 105 NHS projects and will be paying for them until 2050, although the costs will fall towards this date as the payments for earlier projects end.
Similarly, total PFI repayments this year are expected to be about £10.4 billion, but that includes PFIs in other government departments. The Department of Health is the biggest user in terms of costs, but the Departments for Education and Transport and the Ministry of Defence are all big users of PFIs as well.
“Sergeant Blackman… actually saved those 24 people who would have been called out to rescue the Taliban fighter. Now I actually think it was probably a mercy killing by shooting that man on the ground, because he would have died anyway.”
“I know that we’ve seen the footage of him shooting the person being killed on the ground, and I feel that person should have been taken a prisoner not killed in cold blood.”
BBC Question Time audience members, 30 March 2017
We’re not here to factcheck people’s opinions on the Alexander Blackman case, or offer our own interpretation.
We can clarify what evidence about the case is in the public domain and point you to it so that you can make up your own mind.
Sergeant Blackman ended up before a court martial for shooting a wounded Taliban insurgent because army investigators stumbled across recordings of the incident taken by another soldier.
The Court of Appeal refused to order the release of the most graphic clips to the media, accepting that they would be used in terrorist propaganda and “significantly endanger a large number of people”.
Only three of the six clips have been officially released, not including the clip showing the actual shooting.
Differently edited versions of the three video clips that have been released are available on a number of media websites.
There is also a transcript and audio recording of the clips, not released as video, that discuss and include the shooting.
These clips have been summarised by the courts on several occasions, mostly recently by the Court Martial Appeal Court, which decided on 15 March to downgrade Sergeant Blackman’s conviction from murder to manslaughter.
Its four-page summary, starting on paragraph 12, is a particularly valuable summary of the events.
“Looking at the number of people signing up to unions between the ages of 16 and up to 35, it’s negligible, it's tiny. Only 17%: 25 to 34, 5%: 16 to 25.”
Kate Andrews, 31 March 2017
These figures aren’t quite correct. Around 4% of all people in this age group in the UK were employees and members of a union in 2015. That’s around 316,000 people. Meanwhile 13% of 25-34 year olds were employee members of a union that year, or 1.2 million people.
6.5 million people were employees and members of a trade union that year.
Ms Andrews meant to refer to the proportion of all union members who were in these age groups, according to the Institute for Economic Affairs, which Ms Andrews is news editor for.
5% of employee union members in the UK were between the age of 16 and 24 in 2015 and 18% were between the ages 25 and 34.
Comparing to employees rather than the whole population
A better measure might be to look at the proportion of employees who are in these age groups. 9% of all employees age 16 to 24 were union members that year and 20% of all employees were aged 25 to 34.
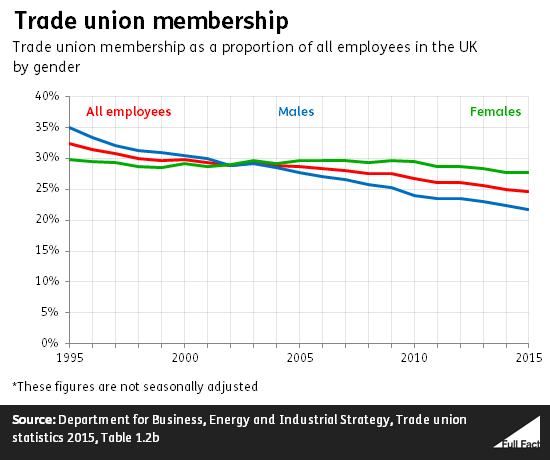
Trade union membership is highest among people over the age of 50, they accounted for 39% of all union members and 33% of all employees this age were union members in 2015.
Overall, 25% of employees of any age were members of trade unions, or around 6.5 million people. This has been declining over the past 20 years, though the decline has been greater among men than women.