Using coin tossing to make our crowdsourcing more efficient
A couple of weeks ago, we launched our second crowdsourcing project, asking thousands of generous supporters to help train up our new Stats Checker tool.
Supporters have so far answered over 81,000 questions to help identify numbers in statements that might appear in our news and politics—but we still need your help to reach 250,000 answers
Join 74,000 newsletter subscribers who trust us to check the facts
Sign up to get weekly updates on politics, immigration, health and more.
Subscribe to weekly email newsletters from Full Fact for updates on politics, immigration, health and more. Our fact checks are free to read but not to produce, so you will also get occasional emails about fundraising and other ways you can help. You can unsubscribe at any time. For more information about how we use your data see our Privacy Policy.
How your answer will make a difference
To keep things as simple as possible, we only ask for direct yes/no answers. We show each question to lots of people and combine their responses to decide a final answer to each question, which we then use to train our models.
But how many individual answers do we need before we can be confident in the final aggregate answer?
Here’s the nerdy bit…
If we had 20 responses to a question and 19 people said “yes” while one said “no”: we’d be happy to take “yes” as our final answer. We’d assume the other person mis-read the question or clicked the wrong button etc. And we would stop asking that particular question: a 21st or 22nd answer would provide us with no new information and so be wasted effort.
But suppose for another question that 12 of the first 20 responses were “yes” and 8 were “no”. We could take a simple majority and label the example as “yes”. Or we could say it’s too close to call and label it as “don’t know”. However, if we carried on collecting more answers from more people and after 40 responses, with 30 “yeses” and only 10 “nos”, we could then decide to take “yes” as the final answer with some confidence. We don’t want to waste our supporters’ efforts, so we need to calculate how few responses we need to each question before we can decide the final answer with a high level of confidence.
Is this coin biased?
Perhaps surprisingly, this problem is equivalent to asking if a coin is biased or not. If after 20 tosses I’ve counted 19 heads and 1 tails, I’d be happy to say the coin is biased towards heads. But if it was 12 to 8, I might want to toss it a few more times before deciding.

This helps us because investigating biased coins has a long history in statistics (along with dice and card games), so we can use well-established solutions to help us. The binomial distribution, defined by Jacob Bernoulli in the late-17th century, is a statistical model of the likely outcomes of a sequence of yes/no events (called Bernoulli trials), such as coin tosses. A few simple equations can tell us things like:
- If I toss a coin 10 times, how many heads need to come up before I can be 95% confident that the coin is biased towards heads?
- What’s the probability of seeing exactly 5 heads after 10 tosses, if the coin is biased and shows heads with a probability of 0.6?
- How many times will I have to toss this coin to have a 99% chance of seeing at least 5 heads?
So as we receive a steady stream of yeses and nos to a particular question, we now keep recalculating the probability that in the long run, the answer will converge to yes or no. And when that probability goes above a certain threshold of confidence, say 99%, we stop asking the question and move on to the next one.
This means we ask for lots of help with the difficult questions where there is disagreement, but quickly move on with the easy ones when everyone agrees.
Easy questions
Here are some examples of questions that lead quickly to a clear outcome. In each case, no more than one person disagreed with the majority view, so we could stop asking the question after only 15-20 answers.
Before the move we were paying £1,000 a month just on rent.
Is this a claim about the amount/value of 'rent'?
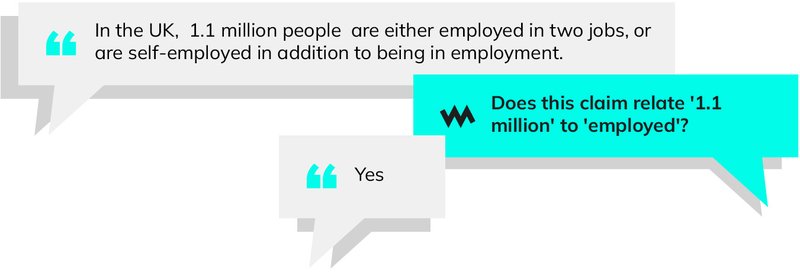
In the UK, 1.1 million people are either employed in two jobs, or are self-employed in addition to being in employment.
Does this claim relate '1.1 million' to 'employed'?
The above all received a majority answer of “yes”; the two below received an answer of “no”.
We've established the £500 million fund to support a Just Transition from fossil fuels in the North East and Moray.
Is this a claim about the amount/value of 'fossil'?
But they came after a year when NatWest has slashed its investment banking division, whose staff typically took some of the largest pay packets.
Is this a claim that the value of 'investment' is (or was or will be) 'moving down'?
Harder questions
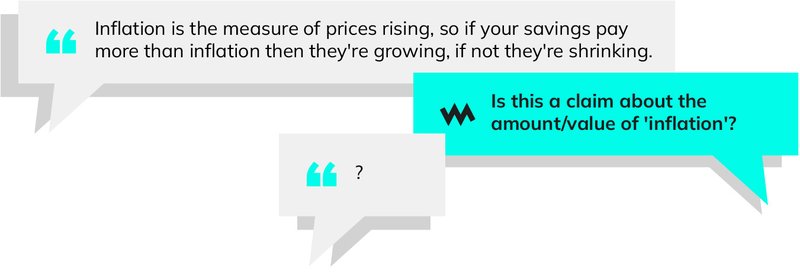
The following examples are of questions where there was no clear agreement - even after 80 or more responses.
Inflation is the measure of prices rising, so if your savings pay more than inflation then they're growing, if not they're shrinking.
Is this a claim about the amount/value of 'inflation'?
Millions have been pushed into poverty while they eat cake.
Is this a claim about the amount/value of 'poverty'?
We saw a sharp fall in inflation when the coronavirus pandemic hit, which meant that the published Premium Bonds rate was higher than the inflation rate – an unusual situation.
Is this a claim about the amount/value of 'inflation'?
The benefits of early stopping
Instead of using Bernoulli’s formulae, we could have used fixed limits. For example, if we asked each question just 20 times, we’d get through a lot more questions - but many would have no conclusive answer. Or if we asked every question 100 times, perhaps we’d have agreed answers to more questions, but fewer questions answered overall.
From the data we’ve collected so far (just over 81,000 annotations in response to 1567 questions) we can measure the benefits. If we’d always waited for 20 responses to each question, we’d have got 770 confident answers out of the 1567, and it would have needed 20×1567=31,340 annotations.
If instead we’d always asked for 100 responses per question, we’d have needed a lot of annotations: 100×1567=156,700 in total. But we would have got definitive answers to more questions, in fact 1137 of them. So five times more annotations would give us an extra 367 useful answers.
Using our Bernoulli strategy, we in fact needed 46,965 annotations to confidently answer 1154 questions, leaving 413 questions that we still don’t have final answers for. So we get a lot more useful answers than if we stopped after 20 repeats, while asking for far fewer annotations in total than if we asked each question 100 times.
Sharp-eyed readers will note that we actually have 81,000 annotations and not the 46,965 we theoretically needed - the discrepancy is that often our annotators were working so hard that our computer hadn’t realised that we had enough annotations and so carried on asking the same question too often before then stopping. We’ve since improved this!
We still need your help
Even with this more efficient way of collecting data, we still need many more examples to train our AI models to be accurate. Every response we collect is used to improve our Stats Checker so it gets better at spotting people misusing or misunderstanding statistical claims. Soon, we’ll be sharing more about what this tool can do, but first we need more data. We’ve set ourselves a target of 250,000 answers - can you help us reach it?