Black people and justice: the viral poster, factchecked
Amid recent high-profile protests by Black Lives Matter campaigners in the UK, a poster showing figures about black people's treatment in the criminal justice system—and one about unemployment—has been circulating on social media.
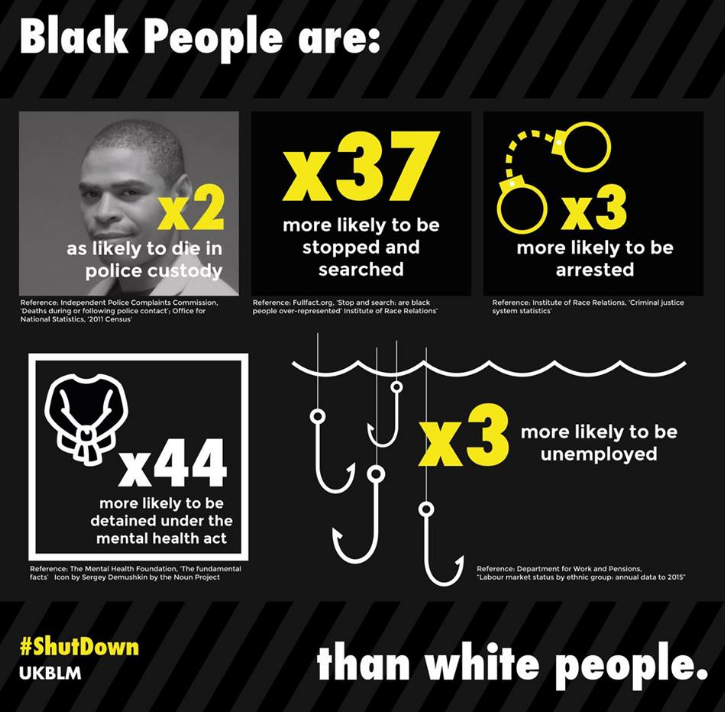
While some of the claims are correct, others use outdated or inaccurate figures which exaggerate the ethnic disparity. The point stands that black people are more likely to be affected than white people in all of the examples chosen.
We've factchecked separately whether black people are treated "unfairly" by the criminal justice system more generally.
“Twice as likely to die in police custody”
This is correct using a set of figures spanning the last decade.
238 people died in or following police custody between 2004/05 to 2015/16, according to the Independent Police Complaints Commission. There are a lot of different circumstances in which these happen, including deaths that happen when someone is being arrested or taken into detention.
Of these, 14 were black and 206 were white.
If you factor in the population, that would make black people about 1.8 times as likely as white people to be killed in or following police custody.
That could be related to the fact that black people are more likely to be arrested in the first place, which we’ve covered further down this piece. There are other figures available on deaths that take place following contact with the police, which we’ve looked at here.
Join 74,000 newsletter subscribers who trust us to check the facts
Sign up to get weekly updates on politics, immigration, health and more.
Subscribe to weekly email newsletters from Full Fact for updates on politics, immigration, health and more. Our fact checks are free to read but not to produce, so you will also get occasional emails about fundraising and other ways you can help. You can unsubscribe at any time. For more information about how we use your data see our Privacy Policy.
“37 times more likely to be stopped and searched”
This is out of date and just refers to a small number of stops and searches (5% at the time).
Overall black people were about four and a half times as likely to be stopped and searched as white people, across England and Wales, in the year to March 2015.
The poster cites an old Full Fact article which said that in 2010/11, under Section 60 of the Criminal Justice and Public Order Act 1994, black people were 37 times as likely to be stopped and searched as white people in England and Wales. Under this Act, police can stop people and search them for weapons, even without grounds for suspecting that they’re carrying any, if senior officers anticipate violence in the area.
This figure was true back then but, as we said at the time, it’s only looking at a small number of stops and searches.
The vast majority happen under Section 1 of the Police and Criminal Evidence Act 1984. For these a police officer must have reasonable grounds for suspicion that someone has a stolen or banned item. In the most recent year, 99.8% of stops and searches happened under this Act, and it was 94% at the time of our old article.
When you look at all stops and searches, the disproportionality is less but still there. It was about 6.5 times as likely back in 2010/11, and has since fallen to 4.5 times.
“Three times more likely to be arrested”
This is right, according to arrest rates gathered by the police.
There were 15 arrests of white people per 1,000 white people in 2014/15. That compares to 45 arrests of black people. These figures base ethnicity on what the people who are arrested define themselves as.
These aren’t arrests for the same type of crime, so statistics like these aren’t enough on their own to prove the system is unfair. As we’ve found recently, other evidence is needed on this topic.
“44 times more likely to be detained under the mental health act”
This is way off and is based on misunderstanding the evidence, although there is still a gap. Black people are about 50% more likely to be detained. The claim suggests it is in the region of 4,300% more likely.
The poster cites this report from the Mental Health Foundation, a charity, which claimed that Black African and Caribbean people are up to 44% more likely to be detained under the Mental Health Act as white people.
So it’s not ‘44 times more likely’ but ‘44% more likely’, which is an order of magnitude difference. Twice as likely, for example, would be a 100% difference, so this is less than half that. It’s also “up to” this much rather than being the standard.
This report also isn’t the source of the figures.
It in turn sources a 2005 report from the Healthcare Commission, giving a range of 33% to 44% more likely. Which brings up another problem: it’s not up to 44% compared to just white people, it’s up to 44% compared to everyone. The differences are actually greater compared to white people – between 43% and 55% more.
We can do better now anyway, as there are more recent figures. They show that in 2014/15 black people were 52% more likely to be detained under the Mental Health Act.
“Three times more likely to be unemployed”
This is right.
About 5% of people who self-define as white were unemployed last year across the UK. ‘Unemployed’ means, broadly, they were out of work but actively looking for a job.
Over the same period about 14% of people identifying as black, African or Caribbean were in the same position. So black people, on this measure, were almost three times as likely to be unemployed as white people.