Are nine out of ten Scots a burden on the state?
After Scottish First Minister Alex Salmond put pen to paper on an agreement for a referendum on Scottish independence with David Cameron yesterday, attention has turned to how Scotland might fare on its own.
Last week Scottish Conservative Leader Ruth Davidson caused a stir when she told a Conference fringe event:
"It is staggering that public sector expenditure makes up a full 50% of Scotland's GDP and only 12% of households are net contributors, where the taxes they pay outweigh the benefits they receive through public spending." - 8 October 2012
It soon led to headlines such as "Nine out of ten Scots 'are a burden on the state'" and a critical article from the Secretary of the Scottish Trades Union Congress asserting that Ms Davidson's sums were wrong.
The 'sums' in question were put together by the Scottish Conservatives using Office for National Statistics (ONS) data on the effects of taxes and benefits on household income, combined with figures from Government Expenditure Revenue Scotland (GERS) on state spending in Scotland.
Join 74,000 newsletter subscribers who trust us to check the facts
Sign up to get weekly updates on politics, immigration, health and more.
Subscribe to weekly email newsletters from Full Fact for updates on politics, immigration, health and more. Our fact checks are free to read but not to produce, so you will also get occasional emails about fundraising and other ways you can help. You can unsubscribe at any time. For more information about how we use your data see our Privacy Policy.
The Scottish Conservatives were kind enough to provide us with a spreadsheet of the estimates.
How the estimate works
The Conservatives started by taking ONS data on tax contributions from all UK households, broken down by income deciles (poorest 10% right up to richest 10%). This was then mixed with GERS data on benefit spending (including 'benefits in kind', such as spending on health services, police and education) per Scottish household, to produce a 'net contribution' figure for each income decile.
One fact that is clear is that the ONS data being used in the estimates is out-of-date. The Scottish Conservatives use the effects of taxes and benefits on household income figures from 2009/10 when the 2010/11 figures are freely avaiable and have been for some time.
The Scottish Conservatives found that the poorest 10% of households made a net contribution of -£23,662 per year; in other words, they drew substantially more from the state than they gave back in taxes. The top 10%, meanwhile, made a positive net contribution of £17,205.
But how can we say on the strength of this data that 88% of households north of the border take more in state handouts than they contribute in taxes, when we only have figures by deciles? Here the Scottish Conservatives rely on some assumptions.
The main assumption is that the distribution of income within each decile is even. In other words, we would assume that the net contribution of each household changes by the same amount in each decile group.
To illustrate this, here is how the Conservatives' calculation appears as a chart:
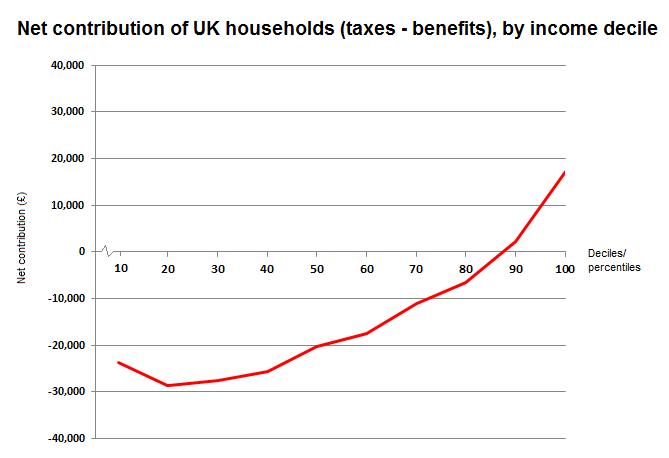
[Each datapoint is graphed in line with the upper bound of the decile - for example the top decile (90-100) point is at the 100th point on the axis rather than midway between 90 and 100. This is to make clear what exact point on the axis the line crosses between the deciles using the Scottish Conservatives' assumptions]
The only official figures being used are ten points of data at each decile (0-10 up to 90-100): by assuming an even distribution within these groups, the Conservatives are able to draw lines between the deciles to create a continuous curve as in the graph above.
What the graph shows is that, based on these assumptions, it is only at the 88th percentile that the line crosses zero and becomes positive. Hence, only the top 12% of people are net contributors and the rest are net recipients from the state.
So how good is the estimate?
That's where the problems start. We've already seen how making a claim this precise involves making assumptions about distributions to fill in the gaps in the data.
This isn't too unreasonable as there's clearly an overall trend across all income groups, and the Conservatives are clear that they have made this assumption. Bolder conceptual leaps are needed however to take the claim any further.
For a start, the ONS data on household incomes, taxes and benefits used in the research refers to all households in the UK, so the researchers assume that the income distribution in the UK as a whole is the same as that in Scotland.
Even more of a problem is in how the researchers interpret the 'benefits' received by households. The ONS data on benefit receipts from the state includes not only standard cash benefits administered by the Department for Work and Pensions and others, but also 'benefits in kind' such as Education and the NHS.
It's obviously harder to estimate the precise value different households receive from these 'benefits in kind', although the ONS does model this for each income decile. It was this data that the Centre for Policy Studies used earlier last week to claim that half of UK households are a burden on the state.
So what is different with the Scottish Conservatives estimate?
The answer is that their figure also includes a number of other 'benefits in kind' such as policing and environmental spending, on top of those counted by the ONS. This means the only items of public spending left out by the Conservatives are defence, general public services and recreation, culture and religion.
To get this more expansive set of figures, the Scottish Conservatives use Scottish Government spending data (GERS), which they weight for each of the income deciles using ONS breakdowns on the proportion of the total benefit bill accounted for by each decile.
It's clear that not only is putting numbers to these benefits problematic in so far as they're being compared to households' individual tax contributions, it also compounds the problem to combine GERS data for Scottish 'benefits' spending with ONS data for UK 'benefits' spending as these aren't entirely comparable datasets.
The alternatives
Using other sections of the same ONS data allows us to deal with some of the research limitations.
For instance, we can do a similar analysis for Scotland using only ONS figures, which resolves the comparability issues associated with combining GERS and ONS data.
In addition, the research uses ONS data for all households, but this doesn't capture the fact that working-age and retired households will have very different characteristics when it comes to how much they contribute and benefit from the state.
The figures themselves show that, while retired households draw far more in the state pension from those of working-age (as we might expect), working-age households take far more away in benefits such as child benefit, housing benefit and out-of-work benefits than do the retired. Many retired individuals who are currently classed as net recipients of state handouts might nevertheless have been net contributors during their working lives.
We could therefore look only at working-age households in order to make the analysis more focussed.
Finally, since regional data on average incomes and benefit receipts is also available from the ONS, the findings (which are for the UK as a whole) can be weighted to correlate more closely with tax and benefit patterns in Scotland specifically, although we still don't know how these contributions are distributed along the income scale.
Adding in these controls allows for new estimates that deal, albeit imperfectly, with some of the problematic assumptions:
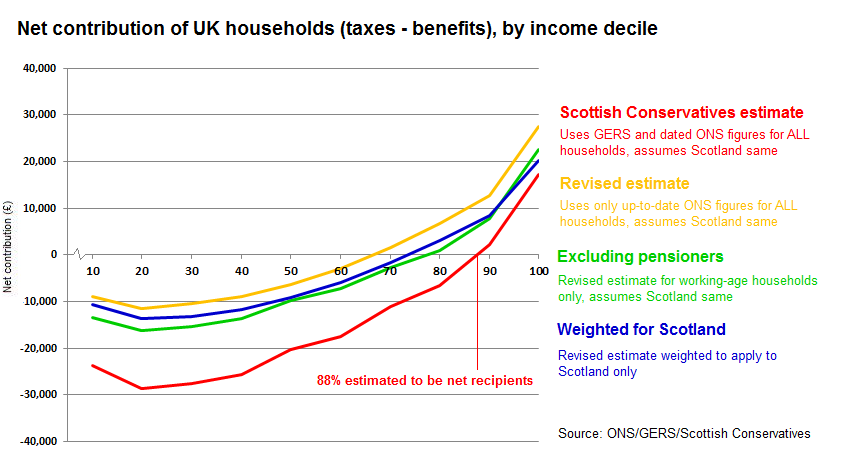
As the graph shows, controlling for some of the assumptions yields quite different results. All three estimates show significantly more net contributions across all income brackets because a number of public services such as public safety, transport and environment protection (that were measured in GERS) are not present in the ONS data.
Conclusion
There are simply too many assumptions in the Scottish Conservatives' data for the findings to be reliable. Some of the figures used are out-of-date, but even then they involve household data for all of the UK, from which the researchers have attempted to draw conclusions about Scotland and for individuals.
Some of the ONS data does allow us to crudely control for some of the more problematic assumptions, but they should serve only to illustrate how changeable the 9 in 10 figure actually is, and how the reality could be that far fewer Scots are net beneficiaries than is being claimed here.
This is one claim that policy-makers would do well to take with a pinch of salt.
Update (18 October 2012)
The Resolution Foundation also conducted an analysis of the ONS data controlling for retired households and highlighting the impact of indirect taxes. Their figures cover cash benefits alone - hence excluding the 'benefits in kind' used by the Scottish Conservatives.
It's important to note that it's not unreasonable to factor in 'benefits in kind' when considering what a household draws from the state as the Scottish Conservatives did - the problem is how to adequately quantify for this effect and select relevant services to be included. Again, this demonstrates that the outcomes of this kind of analysis rest heavily on what factors are included in the numbers and how much weight they are given across the income groups.