Is housing getting less affordable?
It’s almost taken for granted these days that housing isn’t as affordable as it used to be.
But what does ‘affordable’ mean? The word is used to mean different things in different contexts, and there’s no single measure of the ‘right amount’ to spend on housing.
In practice, there are different ways of tracking how housing costs compare to how much money people have, each with their own strengths and weaknesses. We’ve explained some of the main ways below.
Join 74,000 newsletter subscribers who trust us to check the facts
Sign up to get weekly updates on politics, immigration, health and more.
Subscribe to weekly email newsletters from Full Fact for updates on politics, immigration, health and more. Our fact checks are free to read but not to produce, so you will also get occasional emails about fundraising and other ways you can help. You can unsubscribe at any time. For more information about how we use your data see our Privacy Policy.
Comparing house prices to wages
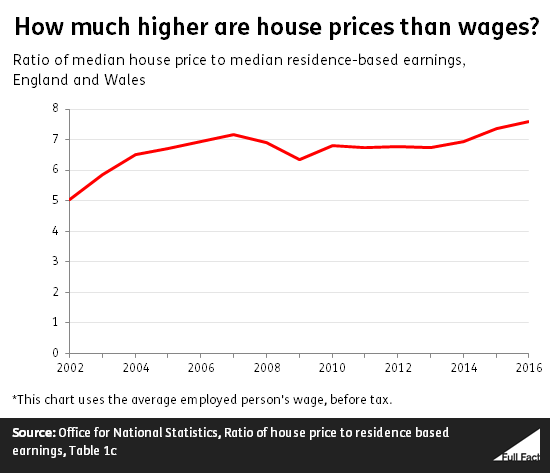
A simple way of tracking affordability is to compare how the median house price and median wage have changed. The median is the house price or wage which is exactly in the middle, half of all are higher and half are lower.
House prices and wages have both gone up in England and Wales over the last 15 years, but house prices have gone up a lot faster. So the median house price was about five times higher than the median wage in 2002, but is now almost eight times higher.
There are actually two ways of measuring wages—you can look at the people who live in an area or who work there. The ONS do both, but we’ve focused on the figure for the people who live in England and Wales because it tells us about people’s ability to buy where they currently live.
The ONS have published an article on this data that uses the workplace measure. It shows a very similar trend over a slightly longer period.
Comparing rent to wages
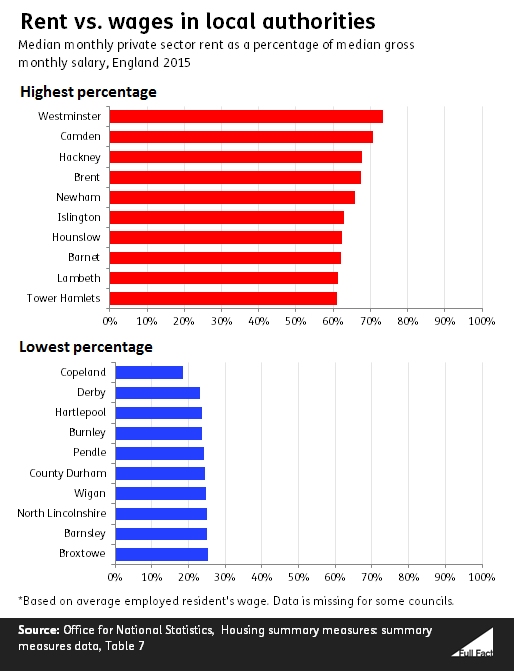
What about costs for private renters? You can take a similar approach by comparing private rents to wages.
It turns out that where you live makes a big difference. The ONS have calculated that in the ‘least affordable’ council in England, Westminster, the median rent was 73% of the median wage in 2015. By contrast, the figure was 19% in Copeland, Cumbria.
Using other experimental figures published by the ONS we can see that the average rent in Great Britain went up by around 12% between April 2011 and April 2016. The average wage went up by around 8% in the same period. So growth in the average wage has been outpaced by growth in rent.
Wages or incomes?
So far, we’ve talked about measures that use the median wage. That’s the amount of pay the ‘middle’ employee gets before things like tax, benefits and pensions are taken into account.
It works as a way of making affordability comparisons over time, or between different places. It’s based on detailed information—the Land Registry’s house price data and the Annual Survey of Hours and Earnings—which means you can make estimates for small areas. Data also becomes available relatively quickly.
But it’s not a good way of finding out how much money people actually have to spend on housing. You need to look at what everyone in a household earns to measure that, because they could all contribute to housing costs. You should also take other income sources and taxes into account.
Comparing housing costs to incomes
One way of using household income to measure affordability is to say that if a household is spending more than a certain percentage of its income on housing costs, then the housing is ‘unaffordable’. Experts have done this in a number of different ways.
Eurostat (the statistical body for the EU) says that households spending more than 40% of their income are in ‘housing cost overburden’. It estimated that 12.5% of the UK population lived in this kind of household in 2015. Across the whole of the EU it was 11.3% in the same year.
The Resolution Foundation think tank did an analysis which set the level of ‘unaffordable’ housing at anything costing over one-third of household income. They found that the amount of households spending more than this went up from 7% of all households in the UK in 1994/95 to 16% in 2013/14.
This kind of approach reveals more about how many people are overladen with housing costs, but it’s not good at distinguishing between rich and poor households. Having two-thirds of your income left after housing costs means something very different to a millionaire than it does for someone on minimum wage.
One way of addressing this problem is to ask whether paying for housing leaves a household with enough left over to meet their other basic needs. This is known as a ‘residual income’ approach.
Almost one in five households in the private rented sector had unaffordable housing, according to a 2016 analysis by social researchers NatCen based on this measure.
So what is ‘affordable housing’?
The term ‘affordable housing’ gets used a lot in policy discussions.
Officially, the term covers social rents—usually set at about half the market rate—and ‘affordable’ rents, which are higher, but no more than 80% of the market rate. It also covers affordable home ownership schemes, which aim to help people spend less to get on the housing ladder.
Deciding who ‘can’t afford housing’ is no easy task, as we’ve seen. Some of these schemes look at income and current housing circumstances as part of deciding who’s eligible. Other affordable home ownership schemes aren’t limited to those with low incomes.
The amount of new housing provided at social rent has decreased in recent years, while the amount provided at affordable rents has increased.