How much did the recession cost households?
"The great Labour recession in 2008 cost every household in this country more than £3,000."
Nick Clegg, Deputy Prime Minister's Questions, 13 May 2014
In response to a question on the Liberal Democrats' economic record while in government at Deputy Prime Minister's Questions this week, Nick Clegg retorted by pointing to the cost to households of the recession under Labour.
A simple calculation of the fall in Gross Domestic Product (GDP) from before the recession to after, divided by the number of households, supports the claim. But the figure Nick Clegg used is out of date - replicating this calculation now puts the figure higher at £3,500 per family.
But GDP isn't just about households, it's a measure of business income generation too - and doesn't tell us much about what impact the recession has had on household finances. Looking at other measures, such as disposable income, suggest the recession interrupted previous year on year increases in take home pay, with a near 2% fall in 2011. But it's open to question as to whether the recession was the sole contributor to these changes.
GDP fell by £110 million
There is actually no official definition of recession, although it has come to be understood as occurring when a country experiences two successive periods of shrinking economic output. In the UK, this means two consecutive quarters (three-month periods) of negative GDP.
Figures from the Office for National Statistics show that annual GDP fell from a peak of £1.56 trillion in 2007 to a low of £1.46 trillion in 2009 - which works out at £3,470 for each of the UK's 26.4 million households in 2013.
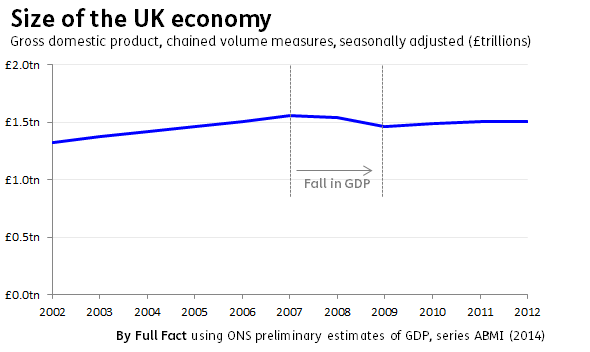
But GDP also takes account of the income generated by businesses. So although the fall in GDP is, in economic terms, what we mean when we talk about the recession, it doesn't actually tell us how (or if) the recession was felt by individual households.
The recession was also experienced globally, so whether or not we can assign responsibility for the decline is open to question.
A more insightful analysis in the cost of the downturn would be to look at how household wealth has changed, using the Wealth and Assets survey, or to look at changes to disposable or individual incomes.
Average household disposable income has fluctuated
Taking the most recent ONS statistics on income, product and spending per head, in real terms, we can see that the year on year increases seen in take home pay before 2008 did not continue in the same way. Pay fluctuated between more modest increases, stagnancy and decline.
The largest fall was in 2011 - so later than the initial decline in GDP. Whether or not we can put this fall entirely down to the recession is open to question, but it's clear that households did see a decline in the money they had available to spend.
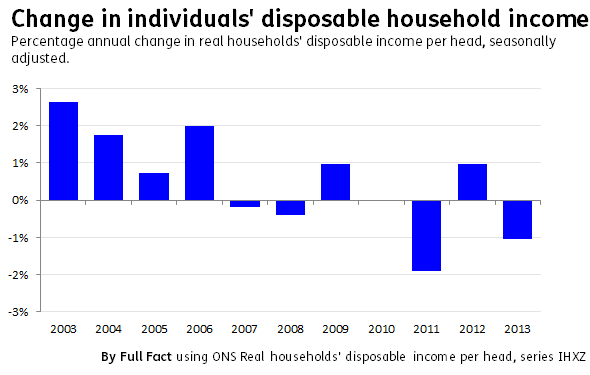
Disposable household income refers to the total amount of money that households have available from their income, minus their taxes and charges, adjusted for inflation - and here calculated as per head.
The other way of looking at changes in living standards is in the calculation used by the Labour party to measure the "cost of living". As we've looked at before, they take average weekly earnings figures from the Office for National Statistics and compare them to rises in inflation to see how earnings have changed in real-terms.
But, these statistics don't account for taxes, benefits and public services. Economists at the Institute for Fiscal Studies and elsewhere have built their own models that factor in these extra sources of income, and these might give a more complete picture of what has happened to living standards since the recession.