Poverty, insecure jobs, and incomes: Prime Minister's Questions, factchecked
Join 74,000 newsletter subscribers who trust us to check the facts
Sign up to get weekly updates on politics, immigration, health and more.
Subscribe to weekly email newsletters from Full Fact for updates on politics, immigration, health and more. Our fact checks are free to read but not to produce, so you will also get occasional emails about fundraising and other ways you can help. You can unsubscribe at any time. For more information about how we use your data see our Privacy Policy.
People living in poverty
“There are now 13.5 million people living in poverty in Britain, up 300,000 in the last year.”—Jeremy Corbyn
“There are 300,000 fewer people in relative poverty since 2010, half a million fewer people in absolute poverty since 2010.”—David Cameron
They’re both right.
There were 13.5 million people living in relative poverty in the UK in 2014/15, after taking into account people’s housing costs. That is also up 300,000 from 2013/14.
"Relative poverty"
Relative poverty is how we describe households who earn less than 60% of what the median household earns. The median household is the household in the middle when you line up households based on what they earn.
"Absolute poverty"
Absolute poverty is almost the same but households are compared to what the median household earned in 2010/11.
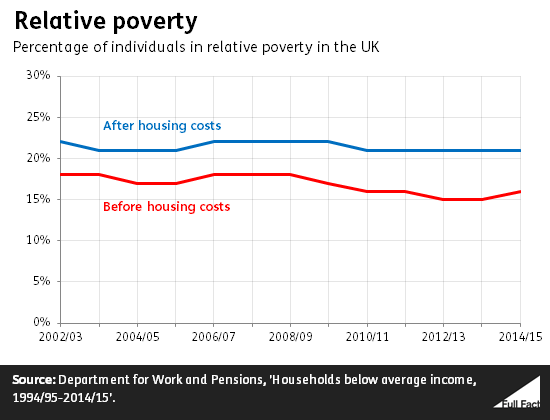
Not taking into account housing costs pushes the overall number of people living in relative poverty down to 10.1 million in 2014/15.
Both the figures Mr Cameron is referring to are measured before housing costs are taken into account.
The number of people living in relative poverty, before housing costs, has fallen from 10.4 million in 2009/10 to 10.1 million in 2014/15. The number living in absolute poverty, before housing costs, has fallen from 9.9 million to 9.4 million over the same time period.
It’s not always helpful to look at how the number of individuals living in poverty has changed over time. As the number of households in the economy grows, all else being equal, it's likely that the number of individuals below the poverty line will also tend to grow. Instead, we can look at the proportion of the population below the poverty line to compare how things have changed.
“...two thirds of children in poverty are living in households where at least one adult is in work.”—Jeremy Corbyn
That’s correct. Around 67% of children living in relative poverty in 2014/15 were living in households where at least one adult was in work. That’s the case both before and after housing costs. The numbers are also very similar for absolute poverty.
Insecure work
“4.5 million people in England and Wales alone are in insecure work…”—Jeremy Corbyn
Recent analysis by the Citizens’ Advice Bureau found that towards the middle of last year 4.5 million people in England and Wales were in what it deems insecure work.
This is based on its analysis of official estimates of the number of people over the age of 16 on a zero hours contract, on a temporary contract, working for an agency, working more than eight hours paid overtime per week or working particular shift patterns (it defines these as split shifts or day/night shifts where the hours vary).
It excludes students.
Incomes
“Income inequality has gone down [since 2010], average incomes have grown at their fastest rate since 2001.”—David Cameron
The Prime Minister’s office said that Mr Cameron was referring to data in a recent report by the Department for Work and Pensions on income inequality before housing costs are taken into account.
By this measure, income inequality did decrease between 2009/10 and 2010/11, but has stayed at a constant level ever since then. A similar picture is true of income inequality after housing costs are taken into account, according to this set of data.
There are a number of ways that income and inequality can be measured, and they can sometimes show different trends.
Commenting on a few different measures, the Office for National Statistics has said:
“The most recent peak in income inequality was in 2006/07 or 2007/08, depending on the measure used. Since then the broad trend has been one of gradual decline in levels of inequality on each of the measures.”
The Prime Minister’s office hasn’t confirmed what data Mr Cameron was referring to when he spoke about average wages. However, the same Department of Work and Pensions report also goes into this.
Its data shows that the median income in the UK, before and after housing costs are taken into account, did increase more from 2013/14 to 2014/15 than at any time since 2001/02, after taking inflation into account.
Before housing costs it increased by 3% from £458 a week in 2013/14 (in 2014/15 prices) to £473 a week in 2014/15. That compares to an increase of 6% between 2000/01 and 2001/02 to £428 a week.
As the chair of the UK Statistics Authority has pointed out, the change in the median wage "does not typically represent the pay rise that most people in employment would actually experience during that period".