Inequality falling by one measure, rising by another
Last week the Prime Minister repeated a claim that "inequality is at its lowest level since the 80s".
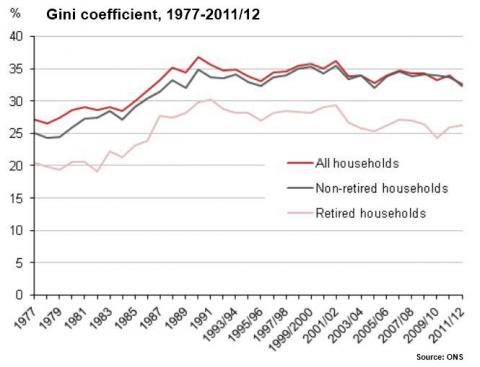
Our previous factcheck found the claim was supported by the Office for National Statistics's measure of the Gini coefficient (one of the most commonly used measures of inequality) for household incomes.
A coefficient of 0 (or 0%) represents a scenario where all incomes are equal, while 1 (or 100%) represents complete inequality.
Join 73,000 newsletter subscribers who trust us to check the facts
Sign up to get weekly updates on politics, immigration, health and more.
Subscribe to weekly email newsletters from Full Fact for updates on politics, immigration, health and more. Our fact checks are free to read but not to produce, so you will also get occasional emails about fundraising and other ways you can help. You can unsubscribe at any time. For more information about how we use your data see our Privacy Policy.
But it's been pointed out to us that other measures of the Gini coefficient show different things. The Institute for Fiscal Studies produces its own measure, which shows rising inequality.
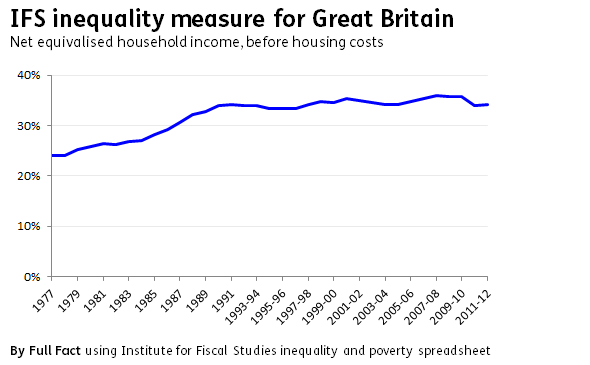
On the surface, both measures seem to look at the same thing: the distribution of household disposable income.
However there are some key differences in the way the figures are produced that might explain the different trends. The IFS told us while it uses household level income statistics, it adjusts the figures to account for the number of individuals in a household. The ONS, meanwhile, don't account for how household composition has changed over time, or how it might be different at different points on the income scale.
This could be significant: if the average household size at the lower end of the income spectrum has grown faster than it has at the top, then the ONS's Gini coefficient might underestimate inequality in terms of the number of people affected.
There's also a difference in the way each measure calculates disposable income. The ONS's measure includes benefits such as company cars, as well as benefits in kind from employers such as subsidised loans for house buying.
But, the ONS's disposable income calculation doesn't include benefits in kind received from the state. So, Free School Meals aren't counted, whereas they are included by the IFS.
Finally, data going back as far as 1977 is only available for Great Britain via the IFS, whereas the ONS's figures also include Northern Ireland.
The IFS found a Gini coefficient of 34% in the UK in 2011/12, compared to the ONS' figure of 32.3%.
Thanks to Declan Gaffney for bringing this story to our attention.