What you need to know about the Treasury's tax statement
"How the biggest chunk of your hard-earned tax goes on welfare: Average worker pays £1,100 towards the bill " — Daily Mail
"Osborne accused of using new tax statements as 'political propaganda'" - The Guardian
The Treasury says that mailing out individual statements this week telling taxpayers what their money is being spent on is an act of transparency. But are the letters really that clear?
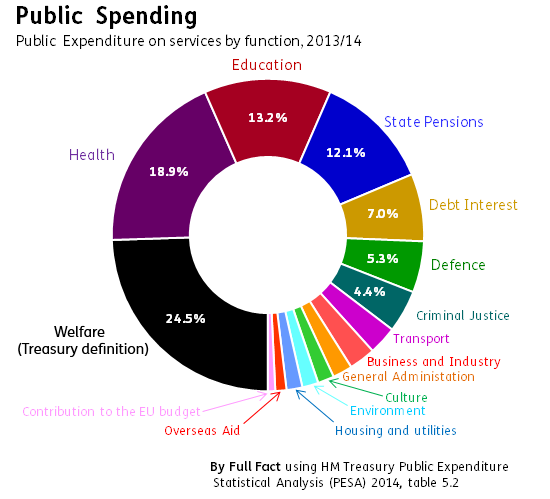
It shows that the biggest chunk of your money, 25%, is spent on 'welfare'—but it's not obvious that that includes public sector pensions.
Among the other quirks thrown up by the Treasury's definitions: 'criminal justice' includes the cost of fire services and 'environment' mostly means collecting rubbish (73% of 'environment' spending goes on waste management).
Are a quarter of your taxes being spent on 'welfare'?
'Welfare' as a spending category was created for this statement. The government has previously defined 'welfare' when it introduced a 'welfare cap', but that covered fewer categories than in this instance.
For your tax letter the Treasury has defined 'welfare' as spending by central and local governments based on international standards and includes much of what you would expect, such as incapacity, disability and unemployment benefits.
But it also includes items like spending on personal social services such as home care and child protection.
The Treasury's tax breakdown has separated out state pensions from 'welfare'. That makes sense as they form a considerable part of total social protection spending and removing them gives a better idea of their relative importance to the budget.
But retaining public sector pensions expenditure within the 'welfare' figure is not such a good choice. These might be better assigned to their area of origin (so teacher's pensions would be classed under education expenditure) reflecting the long term costs of policy decisions. Or they could be listed separately. The amount spent on public sector pensions is overstated; as it's presented in gross terms, it doesn't take into account current contributions.
Here's how government spending will be presented in your tax statement. The breakdown of the 'welfare' part, bottom, won't be included:
The government spends more of your money than this
About 30p in every pound that the government raises through taxation comes from indirect taxes such as VAT that are not considered in this statement. It only looks at contributions from Income Tax and National Insurance and ignores indirect and some direct taxes such as capital gains and inheritance tax.
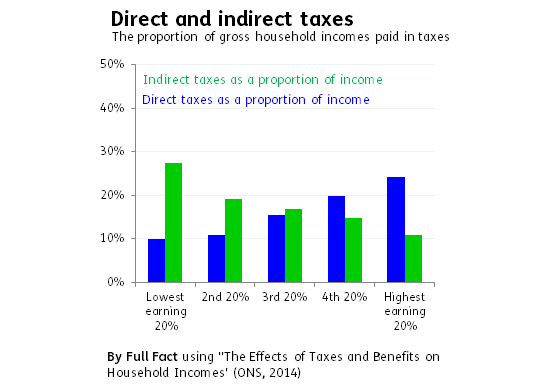
This won't affect the spending side of the statement, but it is significant when it comes to tailoring these letters to the individual's contribution. Higher earners pay a higher proportion of their gross incomes in income taxes and national insurance contributions and pay a lower proportion in indirect taxes according to data from the ONS (see graph below). So lower earners in particular pay a higher proportion of their income in tax than credited in the Treasury's statement.
But the poorest 40% of us actually get more back in cash from the government than we put in (60% of us when services like education and healthcare are taken into account). This is not considered in the statement.
Statistics must be presented in a way which "enhances clarity [and] interpretability", according to the Code of Practice for Official Statistics. A letter using official figures sent to 24 million people which fails to meet these criteria is something about which the UK Statistics Authority should be concerned, and we invited it to take a view.
A spokesman for the UK Statistics Authority confirmed that the Authority is currently reviewing the matter and will respond in due course.