A-level performance: are early academies slipping behind other schools?
"A study of sixth-form results from 2009 to 2012 suggests that the early academic gains may be tailing off — with older academies performing significantly less well than newer ones and those which are still under council control." The Independent, 26 August 2013
A few weeks after the 2013 results were published, A-levels are in the spotlight again.
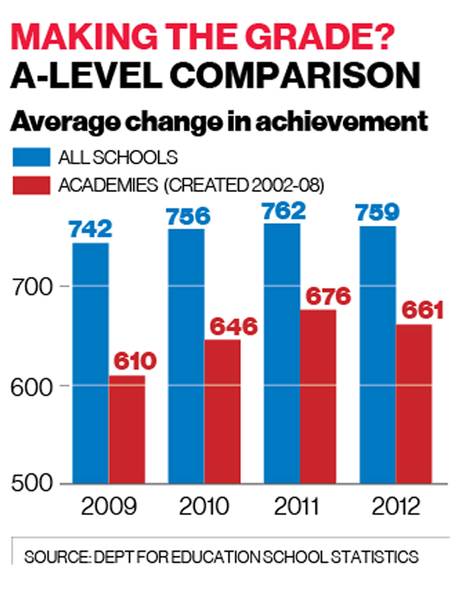
The Independent told readers yesterday that despite early promise, the 'first wave' of 64 academies opened under the previous government (some 64 institutions) has been performing worse than other schools and sixth forms more recently when it comes to Key Stage 5. According to the paper, students sitting A-level exams in 2012 in these academies saw their grades fall more sharply than others:
Join 74,000 newsletter subscribers who trust us to check the facts
Sign up to get weekly updates on politics, immigration, health and more.
Subscribe to weekly email newsletters from Full Fact for updates on politics, immigration, health and more. Our fact checks are free to read but not to produce, so you will also get occasional emails about fundraising and other ways you can help. You can unsubscribe at any time. For more information about how we use your data see our Privacy Policy.
How we measure performance
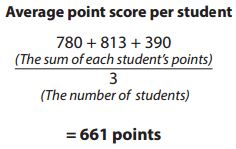
This is calculated by converting grades into point scores, and then dividing the total number of points achieved by students in particular qualifications by the total number of students taking those qualifications.
So the more qualifications a student has, and the higher the grades, the higher the average point score per student.
There's another performance indicator which looks at the average point score per exam entry. This gives us an indication of the average A-level grade achieved by students at an institution. The higher the grade achieved, the higher the points score per examination entry.
According to the DfE, "neither performance indicator should be considered in isolation."
Is the sample too small?
When asked about the findings, a spokesperson from the DfE was quoted in the Independent article saying that the sample size was too small.
The article took into consideration the 64 academies that were built under Labour's administration between 2002 and 2008, and it states that the results were compared against "newer academies and those which are still under council control", some 2,862 institutions, according to data from the Department for Education.
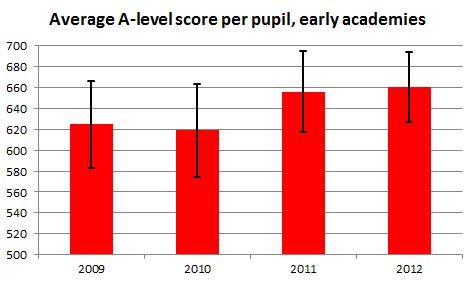
While the Independent wouldn't provide us with a copy of the data it used, so we can't replicate its findings, we can see from the data published by DfE that if we were to put 95% confidence intervals around these figures, as we've done here, we can see that any change between 2011 and 2012 is actually well within the margin of error.
The long-term trend
The Independent focused on the change in performance between 2011 and 2012, with 'first wave' academy scores declining 2.2% compared to the 0.4% fall in other schools and colleges.
However we can also see from its graph that A-levels scores improved by 8.4% between 2009 and 2012 in the 'first wave' academies, whereas the overall improvement across all institutions was a more modest 2.3%.
This raises a question: what happened in 2012? The Independent argues early academies are reverting to "old habits", but it might be a little early to reach that conclusion. It could also be the case that the 2012 results for these academies reflect random sample variation in the data, and that subsequent years will show a regression to the mean.
With 2013 data due in a couple of months, we should know more about whether last year truly represents a turning point for first wave academies soon. As it stands, the more established long term trend actually shows sharper improvements in performance in these institutions than was generally the case elsewhere.
Comparisons with DfE data
The DfE publishes performance data for secondary schools and colleges teaching A-levels here, although the results are slightly different from the ones reported in the Independent.
For starters, according to these tables the score averaged by all schools and colleges in 2012 was 754.5, rather than 759 as was reported in the paper.
We contacted the journalists behind the article to inquire about this discrepancy and to ask them for more information about which schools and academies they looked at, although sadly we haven't been given any further details about their calculations.
However from the data that is published we've compiled our own spreadsheet with performance data from the academies that were launched between 2002 and September 2008.
Interestingly, we found that the 'first wave' academies in our analysis actually improved their performance on a per pupil basis, although we noted the same decline that the Independent did when it came to the average score per entry.
More data on the way
The Independent's diagnosis of recent problems in early academies essentially rests on one single year-on-year change for a relatively small sample of schools. In January 2014 the Department for Education will publish 2013 performance. With this data we'll be able to get a slightly better glimpse of any emerging trend.
Longer term trends in scores per pupil seem to suggest in fact that early academies are improving, but for the time being the jury is still out on early academies.
---
Flickr image courtesy of the Tasmanian Archive and Heritage Office