Tuition fees and access to higher education
In 2012, the government raised the maximum cost of university tuition fees from £3,000 to £9,000 a year, and that has since risen to £9,250. How has that affected the number of people going to university, and has it put off those from disadvantaged backgrounds?
UCAS is one of the main providers of higher education statistics, and it measures disadvantage in a number of ways. This ranges from looking at where a school pupil lives (POLAR3), to also considering their sex, ethnicity, and school-type (MEM), and whether or not they get free school meals (FSM). We focus mainly on those three metrics, looking at rates of entry to UK universities and other higher education institutions among pupils in England.
Record numbers of 18 year olds are entering higher education, across all different advantage levels in the last decade. The difference in entry rates between those from the most advantaged backgrounds, and those from the most disadvantaged backgrounds had been falling. However, in the last few years this trend has stalled somewhat, and in the last two years the gap has begun to rise again on some metrics. This rising gap began a few years after the introduction of £9,000 fees, but we can’t say if they are linked, or what would have happened had fees not been raised.
A lot of the metrics show a dip in entry rates among 18 year olds from all advantage groups in 2012 (the year £9,000 fees were introduced)—but this dip only tends to last a year. Entry levels were extremely high in 2011 (most likely to avoid higher fees), making levels in 2012 comparatively low. By 2013, entry levels generally began increasing again.
The number of 18 year olds entering higher education has risen in every year since 2012, whilst the number of people aged 20 and over has dropped off since 2015.
Throughout this piece we’re talking mainly about entry rates to higher education. That’s the percentage of people accepted into higher education in a given year. The majority of higher education institutions are universities, but it also includes colleges—where you can study for qualifications including a work-related diploma or a higher level apprenticeship.
Join 72,547 people who trust us to check the facts
Subscribe to get weekly updates on politics, immigration, health and more.
Students from the most disadvantaged areas
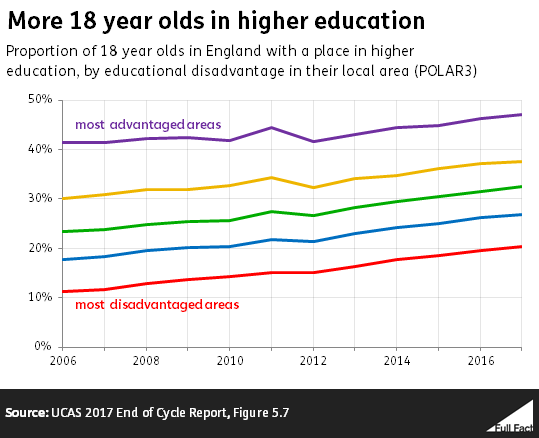
One way UCAS measures disadvantage is by looking at an 18 year old’s likelihood of entering higher education based upon where they live. Called POLAR3, the measure divides small areas of the country into five groups, from those in most disadvantaged areas to most advantaged.
Across all POLAR3 groups, higher education entry rates have increased since 2012.
A higher level of 18 year olds from the most disadvantaged areas are in higher education than ever before—20% of that group entered higher education in 2017, compared to 15% in 2012, and 11% in 2006.
Pupils from the most disadvantaged areas are still less likely to enter higher education, but the gap in entry rates has been narrowing since 2006 (as far back as the data goes). Progress has slowed in the last couple of years, however.
In 2006, those living in the most disadvantaged areas were around four times less likely to enter higher education than those from the least disadvantaged areas. That figure was around three times in 2012, and in 2017 it was around twice as likely.
A wider measure of disadvantage
The Multiple Equality Measure (MEM) looks at educational disadvantage using a wider range of background characteristics, again sorting pupils into five groups.
In 2017, 18 year olds from the most advantaged group were around four times more likely to go into higher education than those in the least advantaged group.
The gap had been narrowing consistently since 2006. However, this has stopped in the last two years.
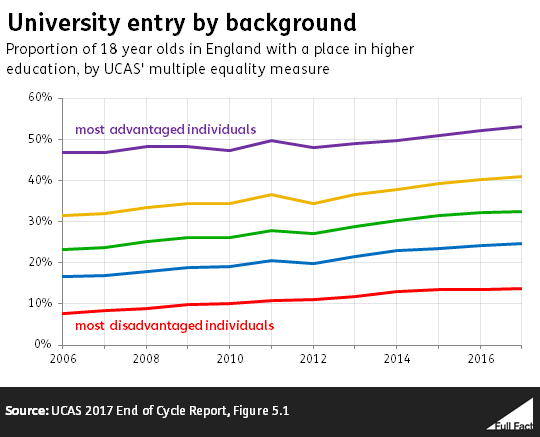
This measure is more experimental and is missing some students, as UCAS has to match higher education entrants in their data with school pupils in the National Pupil Database. It’s not always possible to do that, and in such cases pupils are not counted in the MEM data.
Free school meals pupils
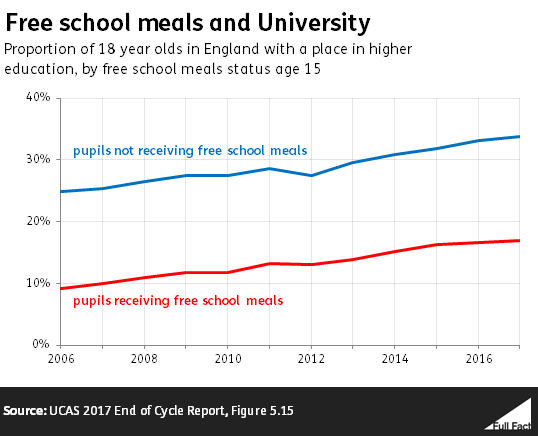
When looking at students who were in receipt of free school meals (FSM) at the age of 15, we see a similar trend in how the gap in entry levels had been falling over time, before rising again slightly in the last couple of years.
In 2017, 17% of 18 year olds who received FSM went into HE, compared to 34% of non-FSM pupils. So non-FSM pupils were twice as likely to enter higher education as those receiving FSM.
There had been a general narrowing of the gap since 2006 (the earliest data we have), when pupils not receiving FSM were around three times more likely to enter higher education. This has stopped in the past two years.
The government publishes its own separate data on FSM pupils in England going into higher education. Unlike UCAS, it also includes 19 year olds in its data.
Compared to UCAS’ data, the government figures find entry rates to be higher among all FSM groups, and the difference between the most and least disadvantaged slightly narrower. Among 18 and 19 year olds starting higher education in 2014/15, 24% of those who received a FSM at age 15 entered further education. Non-FSM pupils were roughly twice as likely to go into higher education than FSM pupils. That’s slightly lower than UCAS’ figure for that year.
The UCAS data shows the gap between the two groups increasing from 2015 onwards. Government data is not yet available for those years—so we don’t know if they also found this trend.
Access to the most selective universities
Some universities are more competitive to get into, and the gap in entry rates is greater in these cases.
UCAS divides higher education providers into three groups based on the average grades among accepted applicants. Higher tariff providers are more selective as they require the highest grades, and UCAS told us the vast majority of higher and medium tariff providers are universities or medical schools.
2.5% of 18 year olds from the most disadvantaged MEM group went to a higher tariff provider in 2017, compared to 14% from the most disadvantaged group going to any higher education institution.
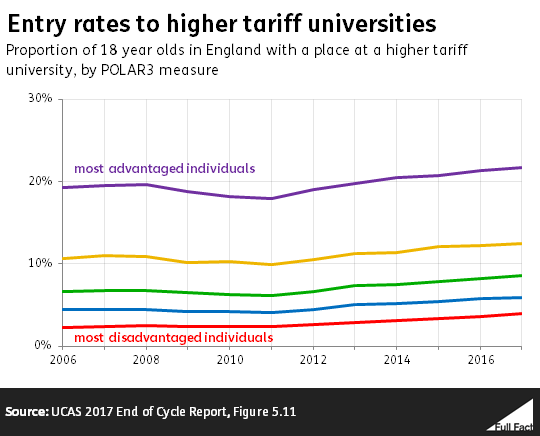
The gap in entry levels between the most and least disadvantaged groups is also wider when looking at higher tariff providers. Those from the most advantaged group were around 10 times more likely to go to a higher tariff university in 2017 than those from the most disadvantaged group. For entry to any higher education institution, the gap is 4 times.
That gap in entry rates between the most and least disadvantaged has been falling consistently over time though.
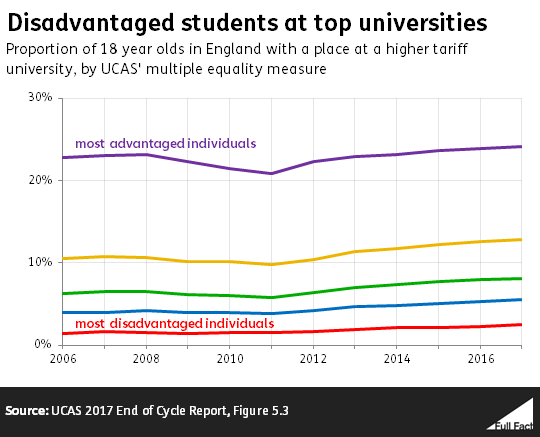
These trends are very similar when using the POLAR3 metric instead of MEM.
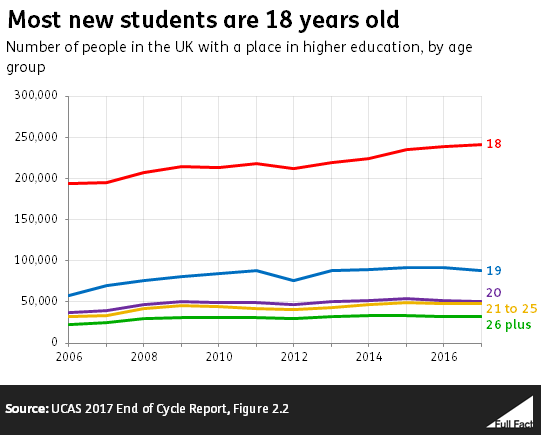
Access by age
18 year olds make up 52% of all people who entered higher education in 2017. Since 2015, the number of higher education entrants has levelled off or declined for all age groups—except for 18 year olds, whose numbers have continued to increase. In the first year of £9,000 fees, the number of 19 year olds enter higher education dropped significantly.
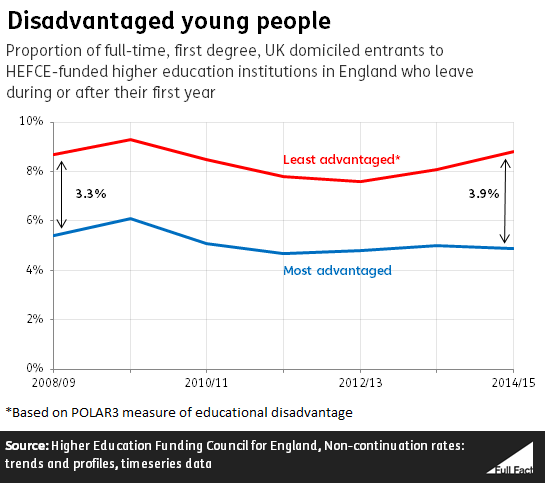
Drop-out rates
Once disadvantaged students are in higher education, they are more likely than their peers to drop out.
8.8% of young students from the most disadvantaged POLAR3 group left higher education after their first year in 2014/15. That’s the highest level since 2009/10, when it was 9.3%. In comparison the drop-out rate for students from the fifth most advantaged areas stayed relatively stable at 4.9%.