What was claimed
Greenhouse gas emissions fell by 15% between 2010 and 2014, one of the biggest reductions in a single parliament.
Our verdict
That’s right.
What was claimed
Greenhouse gas emissions fell by 15% between 2010 and 2014, one of the biggest reductions in a single parliament.
Our verdict
That’s right.
What was claimed
Greenhouse gas emissions fell by 8% in 2014, the largest fall in a single year.
Our verdict
That’s right for carbon dioxide emissions. Looking at all greenhouse gases, the reduction was slightly higher in 2009.
“Between 2010 and 2014 the UK’s greenhouse gas emissions fell by 15%, one of the biggest reductions in a single parliament. Indeed, in 2014 we saw a reduction of 8%, the largest reduction measured in a single year."
Amber Rudd, Shadow Secretary of State for Energy and Climate Change, 18 January 2016
These figures are mostly correct, although reductions in greenhouse gas emissions were slightly bigger in 2009 than in 2014.
The minister may have been thinking about carbon dioxide emissions, rather than all greenhouse gases, when she said 2014’s fall was the largest measured in a single year.
On that measure the reduction was the largest since comparable records began in 1990.
Greenhouse gas emissions have fallen in most years since then, with the reduction from 2010 to 2014 the highest fall in any parliament.
Greenhouse gas emissions are falling
Greenhouse gases prevent heat from escaping from the atmosphere, contributing to global warming.
In 2013 the UK emitted greenhouse gases equivalent to 570 million tonnes of carbon dioxide. Most of the emissions—about 470 million tonnes—actually were carbon dioxide, and the rest were another six gases including methane and nitrous oxide.
The following year, emissions of all greenhouse gases had fallen by 8.4% to 520 million tonnes, with carbon dioxide emissions down 9.7%. That’s according to provisional figures.
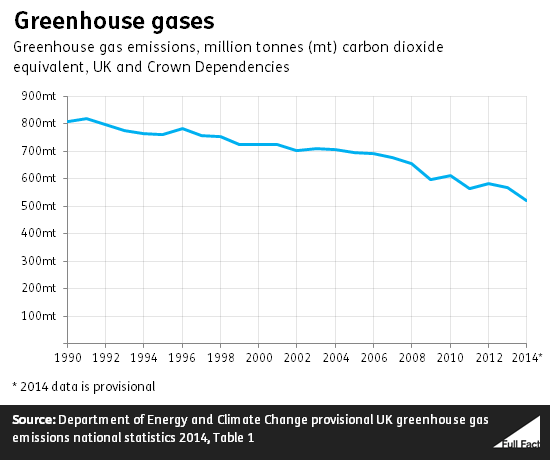
That meant 2014 had the second highest percentage drop over the two decades, behind 8.9% in 2009, when the economy was experiencing a severe downturn. For carbon dioxide emissions it took the record.
It’s not easy to compare how different governments have done in reducing emissions. For one thing, parliaments begin mid-year and the data does not.
Join 74,000 newsletter subscribers who trust us to check the facts
Sign up to get weekly updates on politics, immigration, health and more.
Subscribe to weekly email newsletters from Full Fact for updates on politics, immigration, health and more. Our fact checks are free to read but not to produce, so you will also get occasional emails about fundraising and other ways you can help. You can unsubscribe at any time. For more information about how we use your data see our Privacy Policy.
For another, reductions in emissions now will partly reflect political decisions made in previous years. Renewable power stations, for instance, take a while to plan and build.
With that in mind, it is fair for the minister to say the last parliament saw a large fall in emissions. A 15.1% drop from 2010 to 2014 compares with 14.1% from 2005 to 2009.
The drop in emissions since 1990 is due to a number of factors including a fall in the amount of energy being consumed.
Part of the reason for that is a decline in manufacturing over the period.
Some of what the UK consumes is being manufactured overseas, and emissions from this process aren’t counted in the figures. Any shift towards being a services-based economy which increasingly imports manufactured goods from other countries will tend to shift emissions towards those countries, and that effect isn’t captured by these figures.
Full Fact fights for good, reliable information in the media, online, and in politics.
Fact checking claims made by politicians, public figures and viral online content can give you the full picture backed by the evidence.
Subscribe to weekly email newsletters from Full Fact for updates on politics, immigration, health and more. Our fact checks are free to read but not to produce, so you will also get occasional emails about fundraising and other ways you can help. You can unsubscribe at any time. For more information about how we use your data see our Privacy Policy.