Is it more dangerous to be a pedestrian than a cyclist?
"Mile for mile, it's more dangerous to be a pedestrian than it is to be a cyclist."
The Guardian, 2 August 2012
Bradley Wiggins' victory in the cycling time trial this week was great cause for celebration, not least as it took his total Olympic medal haul to seven, earning him the title of Britain's most decorated Olympian.
However the mood was slightly tempered by the tragic news that a cyclist had been killed in a collision with an Olympic media bus on the same evening - prompting Wiggo to remind the public of the dangers some cyclists face when travelling in the capital.
Join 74,000 newsletter subscribers who trust us to check the facts
Sign up to get weekly updates on politics, immigration, health and more.
Subscribe to weekly email newsletters from Full Fact for updates on politics, immigration, health and more. Our fact checks are free to read but not to produce, so you will also get occasional emails about fundraising and other ways you can help. You can unsubscribe at any time. For more information about how we use your data see our Privacy Policy.
The Guardian followed this up by reporting on the 'less well known' reality that it's more dangerous to be a pedestrian than a cyclist on London's roads.
Is this true, and is it the same case for the rest of the UK?
London casualties
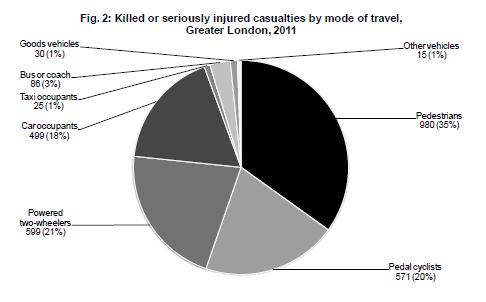
The Guardian columnist helpfully links to the latest casualty statistics for Greater London in making her case. The figures, compiled by Transport for London (TfL), show that in terms of raw numbers, in 2011 more pedestrians were killed, seriously injured and slightly injured than cyclists.
There are obviously a number of ways to measure how 'dangerous' certain modes of transport are, but the Killed and Serious Injury (KSI) rate is a useful starting point:
Of course this doesn't answer the question as to whether walking is mile for mile more dangerous in terms of KSI than cycling in London. For this, we need data on the total distance covered by walkers and cyclists in London to derive a rate.
London casualty rates
Unfortunately, data on pedestrian miles or kilometers travelled in London isn't easy to come by. Full Fact has asked the Guardian journalist and TfL for more information on where these estimates might be found and we're waiting for responses.
TfL does, however, provide estimates of the number of trips and journeys taken daily by different modes of transport.
It's worth bearing in mind the distinctions in the definitions that Full Fact has encountered before - 'trips' refer to complete one-way movements from A to B which can include several distinct stages, whereas 'journeys' are individual sections of a single trip using a particular mode of travel.
In their fourth Travel in London report, TfL estimate that 500,000 cycle trips (where cycling is the dominant form of transport in the trip) take place every day in London (for 2010). This compares to 5,900,000 estimated walking trips. For journey stages, TfL's most recent estimates for both cyclists and pedestrians show identical figures.
TfL measure these using two methods - 'on-mode' methods and via surveys such as the London Travel Demand Survey (LTDS). On-mode methods involve manually counting samples of travellers using parts of the transport network, while the surveys detect individual travelling behaviour.
As such, it must be remembered that these are very broad estimates with wide margins of error.
Taking 2010 casualty data for comparison's sake, the cyclist KSIs for that year totalled 467, out of around 179 million trips taken for the year. Pedestrian KSIs totalled 913 out of 2.15 billion walking trips for the year.
In other words, there were 2,609 cycling KSIs in London per one billion trips in 2010. For pedestrians, there were 425 KSIs in London per one billion trips in 2010. For fatalities, there were 56 deaths per one billion trips for cyclists. For pedestrians, the total was 27 deaths per billion trips.
This does suggest cycling KSIs are higher than that for pedestrians relative to the number of trips, however this isn't particularly useful. The LTDS confirms what we would know intuitively - that the average cycle journey covers far more distance than does the average trip on foot. Without accounting for this, trip or journey numbers alone don't give us very useful findings.
The national picture
Figures for causalty rates nationally are provided by the Department for Transport. They provide casualty rates per billion passenger kilometers travelled for a variety of travel modes. Again, the DfT measures passenger kilometers in similar ways to TfL, extrapolating national estimates from survey data.
For 2010 (the most recent full year for which data is provided), the fatailty rate for cyclists was 22 per billion kilometers travelled compared to 23 per billion for pedestrians. The average from 2001 to 2010 showed the cyclist fatailty rate at 28 compared to 35 for pedestrians.
However when we factor in serious injuries too, cyclists fared worse than pedestrians. In 2010, the cyclists KSI rate was 553 per billion kilometers while the pedestrian rate was 322 per billion kilometers. Averaging across the whole 2001-2010 period, the cyclist rate stands at 556 with pedestrians at 394.
In other words, the national picture suggests cycling is more dangerous that walking taking into account distance travelled, although the death rate alone is greater for pedestrians.
Conclusion
The statistics behind the Guardian's claim that walking is mile for mile more dangerous than cycling in London are, as yet, ellusive. However we hope to say more when the relevant information is made available.
However national evidence from the Department for Transport suggests the picture is, at best, mixed. The overall and KSI casualty rate per billion kilometers travelled is greater for cycling than walking, suggesting that the former is more dangerous on this measure.
That said, the fatality rate alone is slightly higher for pedestrians than for cyclists, suggesting the conclusion depends on what measures you choose to use when measuring 'danger'.