How much more is the NHS spending on private providers?
5 May 2017
What was claimed
The proportion of the NHS budget spent on private providers rose much more quickly under the last Labour government than it has since then.
Our verdict
This is overstating the available figures, which only show spending since 2006/07. The growth rate is similar under both governments, and is higher under Labour counting its spending up to 2010/11.
“The rate of use of non-NHS healthcare was much higher; the growth rate was much higher under Tony Blair's Labour than it has been under the Conservative and Coalition governments.”
This is overstating the available figures, and the wording of the claim needs some clarification.
The Conservatives indicated to us Mr Davis was talking about the proportion of the NHS budget which goes to private providers, not all non-NHS providers. He’s comparing Labour’s record since 2006/07 with that of the Coalition and Conservative governments.
Using these figures, the rate of growth in private providers is very similar under both governments, and is higher under Labour counting its spending up to 2010/11.
Join 74,000 newsletter subscribers who trust us to check the facts
Sign up to get weekly updates on politics, immigration, health and more.
Subscribe to weekly email newsletters from Full Fact for updates on politics, immigration, health and more.
Our fact checks are free to read but not to produce, so you will also get occasional emails about fundraising
and other ways you can help. You can unsubscribe at any time. For more information about how we use your data
see our Privacy Policy.
‘Privatisation’ in context
When people refer to NHS ‘privatisation’, they’re often talking about NHS services that are outsourced to private providers. The use of non-NHS providers to supply NHS-funded hospital care is something that divides public opinion.
‘Non-NHS healthcare’ isn’t the same thing as ‘private’ healthcare. A small amount of the care we receive is also provided by local authorities and charities, purchased by the NHS.
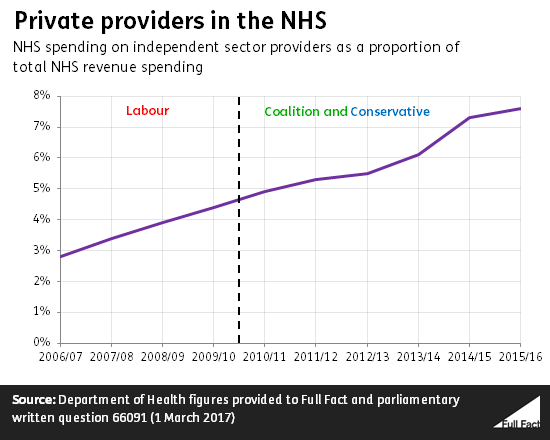
About 7.6% of NHS revenue spending in 2015/16 went on purchasing care just from private providers, according to Department of Health accounts. If you include all non-NHS providers then this goes up to 10.7%.
The government recently published figures on the proportion of the NHS budget spent just on private providers over the past five years and provided older figures to us at the last election in 2015. Using this we can reconstruct a rough picture of what’s been happening since 2006.
2.8% of NHS spending went to private providers in 2006/07, rising to 4.4% in Labour’s last full year in government and 4.9% in the first year of the Coalition.
The rate of growth is actually very similar in Labour’s last years in office compared to the Coalition and Conservative governments. Who is higher is different depending on whether you count 2010/11’s spending as under Labour or the Coalition, which is ambiguous.
The proportion of spending on private providers under Labour rose by 75% if you include 2010/11, compared to 55% since then, those figures are roughly reversed if you look at Labour just up to 2009/10.
Previous research from the King’s Fund has shown that the rate of use of private providers isn’t the same across the NHS. Between 2011/12 and 2012/13 for instance, community health services saw increases in purchases of private care while spending in acute care fell between 2010/11 and 2012/13.
Spending is just one way to measure the level of private involvement in the NHS, another is to look at the proportion of contracts for providing services that they hold. Looking at it this way, a larger proportion of contracts are in the hands of private providers because they tend to hold much smaller contracts than NHS providers.
For example, according to one estimate private providers only accounted for 5% of spending on community care contracts in England, they held 39% of them in 2016. that’s according to Freedom of Information requests from 78% of CCGs gathered by the Health Foundation think tank.
Fact checking claims made by politicians, public figures and viral online content can give you the full picture backed by the evidence.
Subscribe to weekly email newsletters from Full Fact for updates on politics, immigration, health and more.
Our fact checks are free to read but not to produce, so you will also get occasional emails about fundraising
and other ways you can help. You can unsubscribe at any time. For more information about how we use your data
see our Privacy Policy.