How to check coronavirus cases near you
If you live in England, it is easy to check how many cases of Covid-19 are being reported in your area each day. The government publishes this information every afternoon, along with other data, on its coronavirus dashboard.
Join 74,000 newsletter subscribers who trust us to check the facts
Sign up to get weekly updates on politics, immigration, health and more.
Subscribe to weekly email newsletters from Full Fact for updates on politics, immigration, health and more. Our fact checks are free to read but not to produce, so you will also get occasional emails about fundraising and other ways you can help. You can unsubscribe at any time. For more information about how we use your data see our Privacy Policy.
How to check
First, visit coronavirus.data.gov.uk and click on “Cases” on the menu on the left. (Or from the green “Menu” box at the top of the screen, if you’re using a mobile phone.) This will display a bar chart showing the total number of cases reported each day for the whole UK.
To see the number in the area covered by your local council, click on “United Kingdom”, which appears at the top of the page in blue. This reveals two new boxes.
Under “Area type”, select “Local authorities”. Then either type the name of your local authority into the “Area name” box, or select it from the drop-down menu that appears. (If you’re not sure which local authority you need, you can check by postcode here.)
This will display a new chart, showing the number of cases detected in that area each day. (A case means one person with “at least one positive COVID-19 test result”.) For instance for Westminster, where Full Fact is based, it shows this chart.
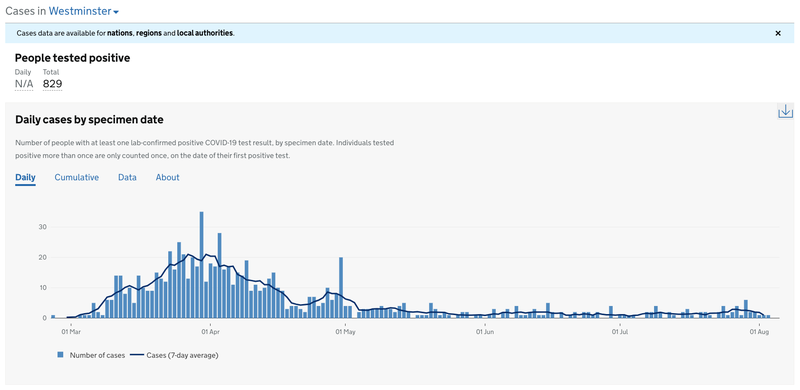
The paler blue bars show the number of Covid-19 cases detected on each day, and the dark blue line shows the average number of cases for the seven-day period around it. Click on “Data” to see a simple list of the number of daily cases.
Each case is assigned to where the infected person lives.
Things to look out for
A case of Covid-19 is reported after a positive test result, but of course we don’t test everyone every day, so some cases go undetected. This means that the blue bars only show a fraction of the new infections actually happening in the real world.
Currently, at the beginning of August, around 130,000 diagnostic tests are processed in the UK each day, to see who needs to be treated or quarantined. In early April, it was around 15,000 a day, yet far more cases were being found.
This means that the case numbers you see today are certainly an underestimate, but the numbers in March or April were probably the tip of a much larger iceberg.
Beware of the delay
Cases for local authorities are reported here by “specimen date”. This means that each case is listed on the day when the infected person took the test, not the day on which the result came back.
On the whole, this gives a more accurate picture of how many people are being infected when, but it also means that some of the most recent tests are not included, because the result has not been recorded yet.
If you look at the cases in your local area, you may well see very few—often zero—in the most recent three or four days. These numbers may rise when they are updated later.
Rutland isn’t Birmingham
Bear in mind that local authorities serve populations of very different sizes. Rutland has about 40,000 people, but there are more than a million in Birmingham.
This means that simply counting cases is often not a good way to compare outbreaks in different areas. Public Health England (PHE) publishes a weekly figure on the number of cases per hundred thousand people, which is a better guide.
It’s also important to remember that some areas are tested more intensively than others, especially when an outbreak has been spotted. In the week that ended on 26 July, for example, 392 out of every 100,000 people were tested in Leicester, which was about four times the testing rate in England as a whole. This means that when many cases are reported in an area, it may cause more cases to be found there.
PHE publishes a Local Authority Watchlist each week, which names the areas of greatest concern. The Department of Health and Social Care also publishes a list of places where local restrictions are currently in place.
What about Scotland, Wales and Northern Ireland?
Local case data has not yet been combined into a single page for the whole UK. Instead, individual data can be found here for Scotland, here for Wales, and here for Northern Ireland.