Are the severely disabled weathering the worst of the cuts?
We published an article on this subject on the 20 March. On review we found that it didn't meet our standards, so this new article replaces that earlier one. We work hard to make sure our factchecks are as accurate and up-to-date as possible, so we're sorry to our readers and those affected for the lapse. We would like to thank those who pointed out inadequacies and helped us fix it. - the Full Fact team
"Disabled people with the greatest needs make up 2% of the population, and yet they are weathering 15% of the cuts. By 2015, the combination of measures targeting this group will amount to losing more than £8,000 each a year."
The Guardian, 14 March, 2013
Join 74,000 newsletter subscribers who trust us to check the facts
Sign up to get weekly updates on politics, immigration, health and more.
Subscribe to weekly email newsletters from Full Fact for updates on politics, immigration, health and more. Our fact checks are free to read but not to produce, so you will also get occasional emails about fundraising and other ways you can help. You can unsubscribe at any time. For more information about how we use your data see our Privacy Policy.
April began with the introduction of the Government's so-called "bedroom tax", which was followed last weekend by the start of the roll-out of the equally controversial Welfare Benefits Uprating Bill, which limits rises to certain social security benefits to 1%.
As you might expect, there has been a great deal of speculation from journalists and politicians alike about who will be most affected by the largest shake-up in the welfare system in recent years.
Last month, the Guardian wrote that disabled people with the greatest needs were shouldering a disproportionately large burden of the cuts being made to social security budgets. According to the paper, although this group only makes up 2% of the total population, it was "weathering" 15% of all the cuts in public spending.
Is this a fact?
The source
Although the author of the Guardian article doesn't identify where this particular statistic comes from, it seems to have been drawn from a report called "A Fair Society?" published in January on behalf of the Campaign For a Fair Society.
This did indeed find that:
"People with severest disabilities (2% of the whole population) bear 15% of all cuts."
What is meant by people with the severest disabilities, and do they make up 2% of the population?
The report is clear that when it refers to those with the severest disabilities - disabled people with the greatest needs in the Guardian's terminology - it means the group of people who require support from local government through the provision of social care services.
According to the report, "approximately 1.3 million children or adults" fall into this category, slightly over 2% of the UK population (and around 2.5% of the English population).
We contacted the author of the report and were told that he had estimated the figure based on data provided by the Commission for Social Care Inspection (CSCI). While the (now defunct) CSCI only covers adults in England, so the report also makes adjustments to ensure that the estimate covers children and the whole of the UK.
According to the CSCI 2005/06 annual report, there were 1.2 million over-65s using social care services in the preceding year in England, as well as 450,000 adults below retirement age.
This number is now slightly dated, and it doesn't count children in social care (which is in A Fair Society?'s calculation).
The CSCI itself did suggest in 2009 that there were 1.75 million social care users of working or retirement age in England, but this figure includes both those services "provided by their local council or purchased on their behalf from private and voluntary organisations."
The NHS Information Centre has put out recent estimates which suggest that almost 1.6 million adults received social care services in 2010/11, but again this figure doesn't include children's social care.
This estimate also differs from the one used in the report because it counts the total number of people to use social care services over the course of a year, whereas A Fair Society? takes a snapshot of the number of people in social care at a moment in time. Given that the sums in the report refer to the average amounts lost over a year, it isn't clear why the report has made this choice.
Similarly, in its report on "The Other Care Crisis", the charity Scope suggests that:
"The number of disabled adults needing care and support is increasing. In 2010/2011, 1.1 million disabled people relied on the social care system, but by 2020 we anticipate that the number of people in need of care will have risen to 1.3 million."
The 1.3 million figure offered by A Fair Society? certainly seems to be in the right ballpark, although it does reach this mark by looking at the number of social care users at a snapshot in time rather than over the course of the year, which is the method favoured by other measures, and it perhaps falls towards the lower end of the spectrum of estimates we've seen.
So how do the sums stack up?
To work out what proportion of the public spending cuts fall upon the severely disabled, we first need to know the size of the total cut in expenditure. To do that, the report adds together the resource budget (the amount of money available to spend on services), capital budget (the amount available to spend on new projects) and Annually Managed Expenditure (costs involved in employing staff and other financial operations associated with running a department) for each area of Government spending set out in the 2010 Spending Review.
This gives us a figure just below the £400 million mark for 2010, but this doesn't include the cost of providing benefits, tax credits and pensions. Once these are added in to the equation, the total rises to £585 million.
Using the projected departmental budgets also set out in the Spending Review and the Government's own claims about the sums that will be shaved from welfare spending (£18 billion was due to be saved in real terms per year by 2014/15 through the welfare reform measures, with a further £4 billion in cuts announced in the 2012 Autumn statement making a total cut of £22 billion) the report then calculates that total spending would stand at £586.1 billion in the last year of the Parliament.
While this is a growth in cash terms, departments will nevertheless have less money to spend in real terms because of the effects of inflation.
To get a real terms figure, the report's author compared changes in departmental budgets over the period to changes in health and pensions spending, which the Government has pledged to protect in real terms. By this method, it is calculated that if all spending had been protected, the total outlay in 2014/15 would be £649.5 billion, meaning that that actual sums available to departments add up to a real terms cut of £63.4 billion.
While this might give a good approximation of the impact of inflation, it isn't entirely accurate. In fact, neither the NHS budget or pensions spending increases exactly in line with inflation, as the pensions are uprated using a "triple lock" system which increases their value either at the rate of inflation or in line with earnings growth or at a rate of 2.5%, whichever is highest. Similarly the Government actually pledged in the Spending Review that it would oversee:
"real terms increases in overall NHS funding in each year to meet the Government's commitment on health spending, with total spending growing by 0.4 per cent over the Spending Review period."
The usual way to adjust cash sums for inflation is to use the Treasury's GDP deflators, and these give us slightly different figures. According to these, if all departmental budgets were protected in real terms, spending by the end of the Parliament would rise to £630.5 billion, meaning that on this measure, the cuts add up to £41.2 billion.
However the report goes further, arguing that because some departmental budgets are actually increasing in real terms over this period, this acts to mask the size of the cuts being made in other areas. Discounting the areas of spending lucky enough to be receiving more funds such as international aid leads the report to calculate that the actual size of the cut is £75.2 billion. Using the GDP deflators, this weighs in at £65.1 billion.
The distribution of cuts
This difference in the overall size of the cuts does have an impact on the amount by which individuals will lose out, although it doesn't necessarily reduce the proportion of the cuts felt by the disabled. In fact, as the £22 billion of welfare cuts is already a real terms figure, using the GDP deflators to reach a baseline actually increases the share taken from benefits spending.
The starting point for A Fair Society? is to calculate the share of the cuts that the average member of the public will shoulder. To do this it looks at cuts which it considers are "not targeted on any particular group" such as reduction in education, transport and policing budgets.
By the report's reckoning, these cuts account for £29.4 billion of spending, which if shared evenly among the UK population of approximately 63 million would mean that the average citizen loses out to the tune of £467 each per year. Using the real terms cut calculated with the GDP deflators, the reduction is less, at £404 per person.
Are disabled people weathering a greater share of the cuts?
The report acknowledges that it is difficult to model the precise impact of current Government policy on disabled people while some of the detail is still unclear, and it calls on the Government to publish a Cumulative Impact Assessment (a document outlining the effect that several separate policy decisions will have on a particular group) looking specifically at disabled and minority groups.
In the absence of Government research, A Fair Society? has produced its own model for calculating the impact on the severely disabled. To do this it considers three areas where severely disabled people face greater exposure to what it sees as the negative affects of the cuts than other members of the public. These are:
- Increased exposure to benefits cuts due to the increased likelihood that the individual is living in poverty;
- Being subject to cuts to disability benefits;
- Feeling the effects of cuts to social care services.
Disabled people in poverty
A Fair Society? argues that of the £22 billion earmarked for cuts in the benefits bill, £18 billion is being taken from poorer people. According to the report, the £4 billion saving made to child benefit spending by removing the eligibility of wealthier parents is the only benefit cut that isn't directed at the poor.
Of this £18 billion, £5.4 billion is highlighted as cuts made specifically from benefits targetted at disabled people specifically, leaving £12.6 billion that affects everyone in poverty (including the disabled).
The report also notes that, according to the Government's official measure, there are 13.5 million people of all ages classed as living in poverty because their household incomes are below 60% of the national median (on the latest data, this total has fallen slightly to 13.1 million).
To calculate the extra burden that cuts in benefit spending place upon those in poverty, the report's author divides the £12.6 billion equally among the 13.5 million people then living in poverty, giving a £934 'cost' per person in poverty.
This obviously assumes that all benefits are claimed solely by those in poverty, but this is contested. Some commentators have in fact accused the previous Labour Government of using the benefits system to bring families above the poverty line as a method of meeting its poverty reduction targets.
Of course not all disabled people are necessarilly in poverty. In fact, the report notes that almost half disabled people are in poverty after the cost of providing for their needs is met (a figure taken from a Demos report, which itself makes use of research from Amartya Sen's book The Idea of Justice).
When it comes to looking at the most severely disabled however, the report does appear to assume that the entirety of this group is in poverty, and claims that as a result, each person in this group stands to lose an extra £934 on top of the £467 cut experienced by the rest of the population.
There aren't any hard and fast figures on whether or not this is the case. The report argues that, due to the "extreme means testing" in social care, "those who receive social care are almost always poor."
What we do know is that, as the Dilnot Commission on Social Care Funding notes, broadly speaking, those with assets worth over £23,250 are excluded from social care. According to the Government's poverty measure (which is itself controversial), 14% of the country's 10 million over-65s live in poverty, approximately 1.4 million people in total. As we've seen, 1.2 million people in this age bracket are currently using social care services.
Cuts to disability benefits
The remaining part of the puzzle when it comes to benefits cuts is the £5.4 billion that the report calculates is being taken from those benefits ringfenced for disabled people, including Disability Living Allowance, Attendance Allowance, and Incapacity Benefit.
Again, the report shares this cut equally between the number of people it estimates that it affects, in this case 5 million disabled people (defined here as those eligible for Attendance Allowance or the Disability Living Allowance).
In February 2013 the DWP revealed that, as of May 2012, 3.26 million people were claiming DLA, while 1.57 million people received Attendance Allowance. This means the total number of claimaints is 4.83 million, or roughly 7.7% of the British population.
Splitting this £5.4 billion cut among 5 million people gives us a reduction in spending of £1,080 per person.
Again, there are question marks about how well this model fits with reality, as it doesn't consider other groups of people who might be affected by these cuts, but not claiming Attendance Allowance or DLA. For example, there are 2.5 million people claiming Incapacity Benefit or Employment and Support Allowance (ESA) in the UK. Some of these may also be claiming DLA, although not all: in May 2011 only 28.3% of ESA claimants were also in receipt of DLA.
If we widen the scope (and therefore the number) of the group of people affected by these cuts, the personal burden shouldered by each diminishes. However it isn't easy to reach a precise figure for this - DWP estimates that there are 11.2 million disabled people in Great Britain, although not all of these claim benefits related to their condition.
This figure also relies on the assumption that all benefits will be cut evenly; that because disability benefits currently make 30% of benefits spending, they will also account for 30% of the reduction in benefit spending.
However the Government has repeatedly claimed that in fact, disability benefits will be protected from many of the cuts. For example, DLA, Attendance Allowance and part of the Employment and Support Allowance will not be subject to the uprating cap which limits payments to other types of benefit and tax credit.
Another contentious assumption is that the entire reduction in spending on disability benefits will necessarily be felt by disabled people. There are a number of alternative explanations for reduced welfare spending in this area, including the provision of better in-work support for disabled people and a reduction in the number of people claiming disability benefits to which they're not entitled.
Social care cuts
By far the largest slice of the additional burden that the report claims is placed upon the severely disabled comes from the reductions in social care spending.
This is calculated slightly differently to the other cuts that are being "weathered" by disabled people, as it is based upon actual spending data rather than the projections found in the Spending Review.
Adass, the Association of Directors of Adult Social Services, conducts budget surveys among its members in local authorities to work out how much money is being spent in the sector each year.
This found that in 2011 £991 million less was spent by councils on adult social care than was the previous year, while in 2012 this reduced by a further £890 million, giving a total cut of £1.88 billion since the Spending Review.
To this, the report adds the £1.85bn in cuts to children's social services over the same period, according to a report on the topic produced for the NSPCC by the Chartered Institute of Public Finance and Accountancy, giving a grand total of £3.73 billion that it says has been taken from social care spending over the past two years.
Having got in touch with the author to clarify this further, we were then told that this sum was divided by two to get an annual cut of around £1.87 billion, and then multiplied by five to get a figure for the Parliament of £9.3 billion. This was rounded down to £8 billion "to be on the safe side". Dividing this £8 billion cut between the 1.3 million people identified by the report as severely disabled gives us a reduction in spending of £6,154 per person.
Because of the large sums involved, this figure is very sensitive to small changes in the estimated number of people falling into this category. For example, if we take the NHS Information Centre's figure of 1.58 million people requiring social care in 2010/11, the total personal "burden" falls by over £1,000.
There are also questions about whether the reductions in social care budgets will necessarily be "shouldered" by those using the service. According to ADASS themselves, most of the £890 million cut in 2012 didn't come from front-line services:
"In delivering the reductions councils have to make, adult social care has sought to protect frontline services with £688m of planned reductions being secured through service re?design and efficiency."
It notes that £113 million came from reduced services, and £77 million from higher charges. If we accept that front-line services are indeed protected from these "efficiency savings" (and this is a contentious issue), then only around a fifth of the cuts actually fall upon service users.
Finally, this calculation assumes that the level of cuts seen in previous years will continue until 2015. Again, this is contentious. The NSPCC report cited by A Fair Society?, for example, notes that:
"the Spending Review 'front-loaded' many of the cuts and required English councils to make drastic reductions in 2011—12, budgets in subsequent years are unlikely to be reduced quite as much."
This could be the reason that the total of £9.3 billion was reduced to £8 billion in the the report, but it must be stressed that if this is the case, there is a great deal of uncertainty about the final figure reached.
The final reckoning
Adding together the £467 reduction in spending for all individuals that results from smaller public service budgets, the £934 extra that the report claims is "shouldered" by people in poverty, the £1,080 cut in benefits specifically directed at them and the £6,154 reduction per person for social care services gives a grand total of £8,635, over the threshold set by the Guardian.
If we accept this figure offered by A Fair Society? the collective cut felt by the 1.3 million people it classes as the most severely disabled would equal £11.2 billion. This is 15% of the £75.4 billion total reduction that the report estimates is being made in total spending.
Conclusion
The Guardian's claim that 2% of the population - disabled people with the greatest needs - are weathering 15% of all spending cuts, and that each person in this category stands to lose over £8,000, is presented as a statement of fact. While the statistics can be traced back to a substantial piece of research, the estimates are rather more uncertain than the Guardian allows for, and a number of the assumptions that underpin the figures can be challenged.
By using GDP deflators rather than departmental budgets to calculate real-terms figures, excluding childrens social care from the calculations and accounting for the "front-loading" of certain cuts, a reader could justifiably reach different figures.
The scope of the report also means that certain factors that could inflate or deflate the figures are not considered. For example, taking into account tax changes could, as the author suggests, mean that the relative size of the "burden" placed on the severely disabled increases as a result of the VAT increase. However it's also possible that it might fall, given the changes made to personal allowances.
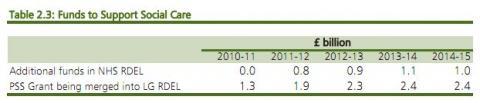
Besides this, other problems remain. For example, while the report breaks down benefits spending into its constituent parts, it doesn't do the same with other areas of spending. This means it misses things that could affect the overall cut experienced by the severely disabled, such as the £3.8 billion added to the NHS budget in the 2010 Spending Review to help fund social care:
The impact that changes in public spending have on groups that might be particularly affected by them is certainly a matter of real public concern, and A Fair Society? offers some interesting research in this area. However it is important to be clear about the uncertainty that we must attach to these estimates: as the report itself notes, there isn't enough information publicly available to be able to conclusively calculate the extent to which the severely disabled are affected by public spending cuts above and beyond the wider public. This isn't something that is clear from the Guardian's article. In fact, the report calls upon the Government to undertake its own Impact Assessment on the topic so we can have a more informed discussion about the impact of the changes in the benefit system.