Did lending to businesses fall by £14 billion in the last year?
"Lending to business has fallen by £14 billion over the last year"
Labour Party Website, 29 March 2012
Last week the Shadow Business Secretary Chuka Umunna announced that lending to business had fallen by £14 billion over the last year. This was, he said, in spite of the Government's Project Merlin which was designed to increase the amount of money banks lend to businesses.
Mr Umunna also claimed that there had been "precisely no growth" in the UK economy since the Chancellor's spending review in October 2010.
So are any of these claims true?
Analysis
Mr Umunna's first claim relates to the amount that banks lend to businesses, an issue which Full Fact has previously covered. His most recent statement is based on the latest Bank of England Trends in lending data published on 29 March.
The publication provides figures on the "net monthly flow" of lending to UK businesses. The figures available provide monthly flows back to the start of 2007:
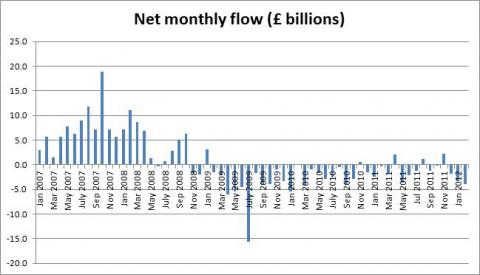
This graph shows the net monthly flow of lending in billions of pounds from banks to businesses. This data confirms that in the 12 months up to and including February 2012 net lending to business by banks fell by £14 billion.
Based on this measurement of lending to businesses Mr Umunna's claims are accurate.
Mr Umunna then went on to claim that Project Merlin was a failure. Project Merlin was an agreement between five major banks and the UK Government to, amongst other things, increase lending to businesses. As Full Fact previously found, however, this very much depends on what measurements you use.
Mr Umunna then went on to say:
"This week, it has been confirmed that there has been precisely no growth since the Chancellor's 2010 Spending Review."
Mr Umunna seems to be referring to the release last Wednesday by the Office of National Statistics (ONS) of their March GDP Update. The update reported that GDP had fallen by 0.3 per cent for the last quarter of 2011.
To measure how the UK's GDP for the final quarter of 2011 compares to the GDP at the time of the October 2010 Spending Review, we can take an 'index' figure. This involves taking the GDP in the first quarter of 2008 and comparing all other GDP levels to it:
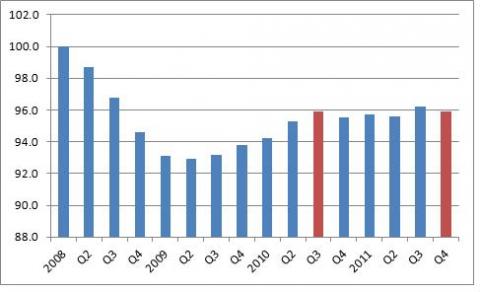
This graph shows the levels GDP as a percentage of the 2008 first quarter level. The first quarter of 2008 is used as 100 per cent in this measurement and every subsequent quarter is represented as a percentage of the first quarter in 2008.
The 2010 Spending Review occurred in October 2010, so if we take the percentage GDP for the previous quarter - the third quarter of 2010 [July-August-September], we see GDP at 95.9 per cent of the Q1 2008 figure.
The fourth quarter of 2011 also shows GDP at 95.9 percent of the 2008 start level. The relevant quarters have been highlighted in the graph.
Conclusion
Mr Umunna's claim about the lending to businesses is also correct based on the Bank of England's Trends in Lending data.
While we cannot get a precise figure for October 2010, using the previous quarter's data Mr Umunna is also accurate in saying that there has been no growth in the economy since the 2010 Spending Review. There have, of course, been quarters of growth and contraction since 2010, but the GDP total ends up roughly equal when comparing start and finish.
This assertion, of course, be understood in context. GDP growth has been zero compared to the third quarter of 2010, although it has increased compared to the second quarter - often used as a proxy of when the Coalition Government came to power.