How likely are black people to be stopped and searched by police?
"According to official statistics, in 1999-2000, a black person was five times more likely than a white person to be stopped by police. A decade later, they were seven times more likely."
The Guardian, 3 January 2012
"It is a shocking statistic, but black people are 26 times more likely than whites to be stopped and searched by the police under Section 60 of the Criminal Justice and Pubic Order Act in England and Wales."
Owen Jones, writing in The Independent, 5 January 2012
Join 72,953 people who trust us to check the facts
Sign up to get weekly updates on politics, immigration, health and more.
Subscribe to weekly email newsletters from Full Fact for updates on politics, immigration, health and more. Our fact checks are free to read but not to produce, so you will also get occasional emails about fundraising and other ways you can help. You can unsubscribe at any time. For more information about how we use your data see our Privacy Policy.
News organisations have ran a large number of stories for the last few days reporting and commenting on the wider ramifications of the convictions in the Stephen Lawrence murder case.
Many of these pieces, such as that written by author Owen Jones in today's Independent, asked questions about the assumptions people make regarding race and class relations in the UK.
Among his comments was the use of a much mentioned statistic that black people are 26 times more likely to be stopped and searched by police than white people, under section 60 of the Criminal Justice and Public Order Act in England and Wales.
But as a Guardian piece from Tuesday demonstrated, this is not the only figure in circulation. In fact, it is also claimed that a black person is seven times more likely to be stopped and searched.
Full Fact decided to find out what was behind this huge difference.
Analysis
Data on instances of Stop and Search can be found in Ministry of Justice statistics on Race and the Criminal Justice System. What is immediately obvious is that there is not one simple measure of how many people are stopped in England and Wales. In fact, figures on Stop and Search are broken down by the act under which they were implemented.
There are three Acts measured by ethnicity under which a Stop and Search power can be invoked: Section 1 of the Police and Criminal Evidence Act (1984); Section 60 of the Criminal Justice and Public Order Act (1994); and Section 4 of the Terrorism Act (2000).
The 1984 Act allows a search to be conducted when an officer has reasonable grounds for suspicion that a person or vehicle may be carrying stolen or prohibited items. The 1994 Act extends this to when there is a percieved threat of serious violence. The 2000 Act extends this still further to the right to search for items that could be used in connection with terrorist acts.
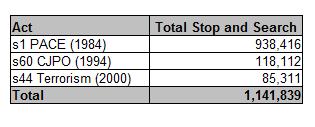
The Ministry of Justice data shows how many people are stopped under each act in 2009/10:

Mr Jones' 26 times figure, which deals with the 118,112 Section 60 cases, emanates from research conducted by Michael Shiner from LSE and Rebekah Delsol from the Open Society Justice Initiative on behalf of the StopWatch group.
Full Fact was informed that the research had taken data from the most recent Ministry of Justice figures and used population data from the 2001 Census to derive estimates for how much more often black people were stopped and searched compared to white people, specifically under Section 60 of the 1994 act.
The table below shows the basis of the researchers' figures:

40 per cent of all Stop and Searches were conducted on white people, while 33 per cent were conducted on black people. Adding in data from the Census allowed the researchers to conclude that, given the actual number of white and black people in the UK, a black person was 26 times more likely to be stopped than a white person.
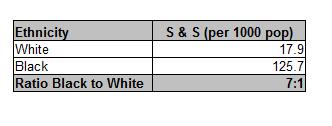
So what of the "seven times more likely" figure? With a little more digging, this was found to derive from Stop and Search figures in total, encompassing all three acts:

As can be seen, in this instance the Ministry of Justice statistics themselves provide a 'per 1000' calculation, allowing us to see precisely where the 7:1 ratio comes from. The figure for all persons is 24 people per 1000.
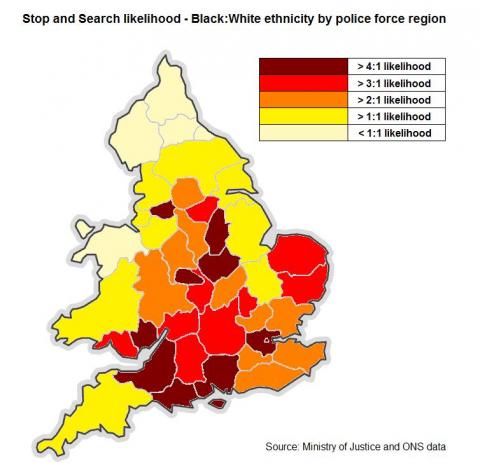
The statistics also provide a breakdown by region, which is graphed below:

The ONS, however, cautions against over-reliance on these statistics. Regarding the 7:1 ratio, the 'per 1000' calculation uses what the ONS terms "Population Estimates by Ethnic Group" (PEEGs). These, in essence, allow ethnic population numbers to be measured between national Censuses which occur only every ten years.
The ONS stress that this form of measurement is "experimental" meaning that they have not yet reached the standards of official statistics. So while the nominal figures of Stop and Searches are avaiable, applying these to actual population distributions may not be fully accurate.
The LSE/Open Society research that derived the 26:1 ratio did use data from the 2001 Census, which avoids these problems. The drawback of this however is that the data is now over a decade old and, again, we cannot say for sure how accurate their figures would be today.
Conclusion
The confusion that could be caused in seeing the different statistics lies in the nuance of which Acts they are dealing with when describing the detention of persons under Stop and Search powers. The 26:1 ratio deals with Section 60 stops specifically, while the 7:1 ratio deals with all stops.
Given that the majority of Stop and Searches are conducted not under Section 60, but under Section 1 of the 1984 Act, (938,416), this means that to take merely the Section 60 cases could lead to an exaggerated impression of the overall ratio of Stop and Searches between different ethnicities in England and Wales.
Moreover, the caveats to both sets of data cannot be ignored. The 26:1 ratio is reliable but dated; while the 7:1 ratio is less reliable statistically, but up-to-date.
-----
Front page photo attributed to Kashklick on flickr
UPDATE (5/01/12)
Thanks to a reader on Twitter, we have added the clarification that there are not necessarily only these three Acts under which a person can be stopped and searched, but these are the only three for which data is recorded ion ethnicity.