How many disadvantaged young people are applying for university?
"On the all-important issue of the number of applications to university in the recent UCAS figures, which have been published overnight, the proportion of English school leavers applying to university is, in fact, the second highest on record.
The percentage of 18-year-olds from disadvantaged areas applying to university is, according to the figures we have seen overnight, higher than at any time under the Labour Government."
Nick Clegg, House of Commons Topical Questions, 10 July 2012
Deputy Prime Minister Nick Clegg was put on the spot this week by Labour MP Stephen Hepburn, who slammed the Coalition's decision to raise the tuition fees cap to £9,000 after his home region of the North East saw a 12 per cent decline in university applications.
Join 72,953 people who trust us to check the facts
Sign up to get weekly updates on politics, immigration, health and more.
Subscribe to weekly email newsletters from Full Fact for updates on politics, immigration, health and more. Our fact checks are free to read but not to produce, so you will also get occasional emails about fundraising and other ways you can help. You can unsubscribe at any time. For more information about how we use your data see our Privacy Policy.
Mr Clegg hit back by saying the proportion of English school leavers applying to university remains the second highest on record, and that the percentage of disadvantaged young people applying to university stood higher than at any time under the previous government.
So where's he getting his figures from?
Analysis
UCAS - the body responsible for providing admissions services to people applying for higher education - publishes admissions statistics on an almost monthly basis. The spark for news reports this week on applicant numbers was UCAS's latest release for June 2012.
These figures only cover applications that meet UCAS's 30 June deadline, after which point applications go to clearing. Hence the information we have for 2012 doesn't include any additional applications or acceptances that go through the clearing process.
The headline takeways from the June 2012 statistics are that overall applications between September 2011 and June 2012 are down by 7.7 per cent compared to the same period in the previous year. Applications from UK students alone are down by 8.9 per cent.
The figures also support Stephen Hepburn's claims that applications from people domiciled in the North East are down by just under 12 per cent.
Application rates
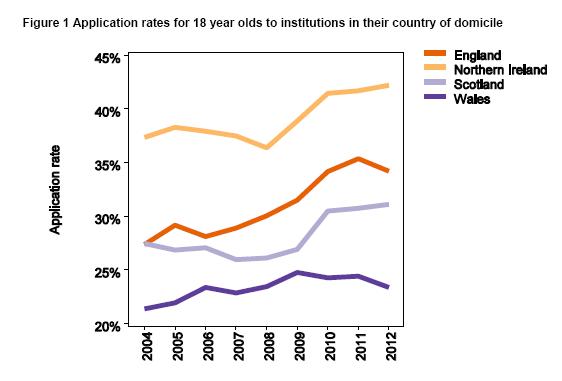
The source of Nick Clegg's first claim about the application rate of English school leavers (using 18 year-olds as the proxy) isn't difficult to find in a recent UCAS analysis paper, although the data only provides application rates going back to 2004:

The graph shows the application rate for 18 year-olds applying to universities in the same country they live in (i.e. young people based in England applying to English institutions). This shows an application rate of 34.2 per cent in 2012 for English-based 18 year-olds, down from 35.4 per cent in 2011. It is the 'joint' second highest rate recorded since 2004, sharing with 2010 which also recorded a 34.2 per cent rate.
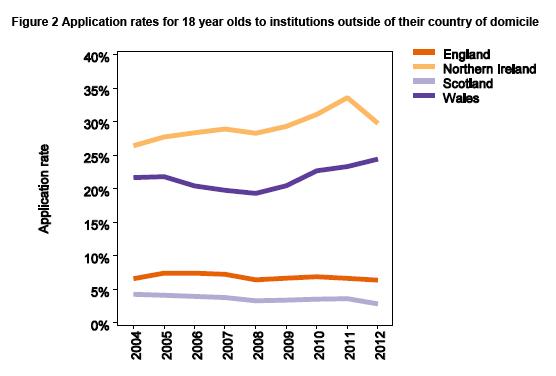
However that isn't the whole story, as some students apply to institutions outside their country of residence. More detailed figures on where exactly these students go are available in the paper, but taking the application rates overall does show a slightly different picture:

Just over 6 per cent of 18 year-olds in England applied for university in an insitution outside their home country - a rate dwarfed by Welsh and Northern Irish school leavers. This rate is more stable and even showing slight decline since 2010.
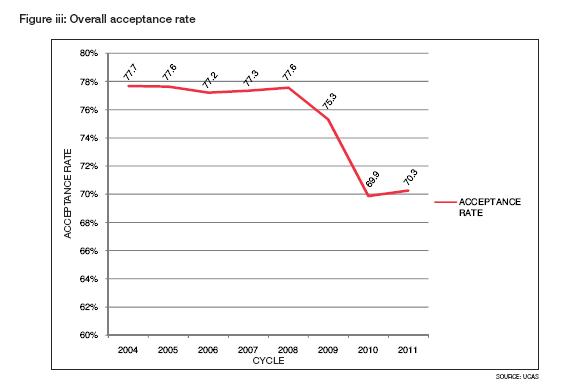
It't still fair to say that, overall, the application rate is among the highest it has been on the recorded figures since 2004. Of course, it's always worth bearing in mind that acceptance rates show a less positive picture. While the 2012 data isn't yet complete, recent trends show a sharp decline since 2008:

Disadvantaged applications
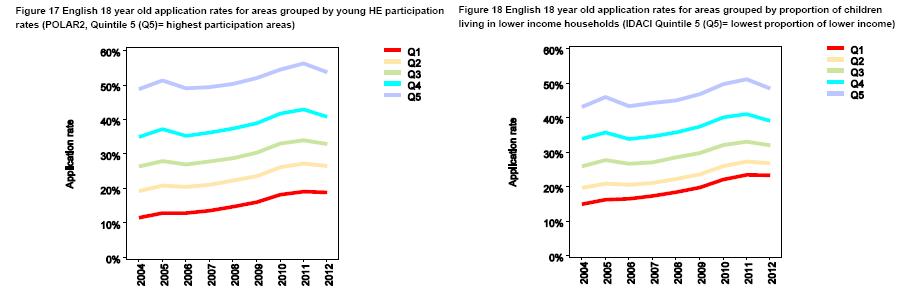
The UCAS analysis also provides data on the number of young people from 'disadvantaged backgrounds' applying for university. UCAS measure disadvantage using two main indicators:
1) Participation levels in Higher Education - splitting the young population into five roughly equal sections according to their participation rate in higher education.
2) Percentage of children living in low-income households (Income Deprivation Affecting Children Index) - the proportion of young people under 16 in low-income households, again split into five equal sections.
The UCAS figures show that the application rate for the most disadvantaged young people (Qunitile 1 in each case) has risen steadily since 2004, now standing at around 19 per cent.

While the proportion of the lowest quintile has flatlined if not slightly fallen on 2011, the rate remains higher than at any point in the previous Government's tenure since 2004.
Conclusion
The Deputy Prime Minister's comments in the Commons this week are accurate, however it should be pointed out that participation rates overall and among disadvantaged groups have fallen slightly this year.
Nevertheless, to some these declines will seem modest compared to some predictions that the tuition fee rise would deter a large number of young people from applying for university. UCAS do say that 15,000 fewer young people did not apply this year who would have been expected to do so last year, however there has not been a disproportionate impact on disadvantaged groups. UCAS summarise it best:
"This in-depth analysis of the 2012 applications data shows that, although there has been a reduction in application rates where tuition fees have increased, there has not been a disproportionate effect on more disadvantaged groups"