Inequality at its lowest level since 80s
In a comment piece in the Mirror this morning, Ed Miliband claimed that:
"You see a privileged few at the top doing well but you are being left further behind amid rising inequality".
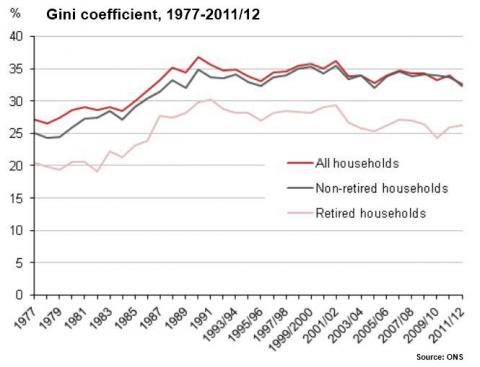
One of the most commonly used measures of inequality is the Gini coefficient, which shows how far the income distribution of a country diverges from perfect equality.
The latest statistics found that the Gini coefficient for disposable income in 2011/12 was 32.3% - the lowest level since 1986.
Join 73,000 newsletter subscribers who trust us to check the facts
Sign up to get weekly updates on politics, immigration, health and more.
Subscribe to weekly email newsletters from Full Fact for updates on politics, immigration, health and more. Our fact checks are free to read but not to produce, so you will also get occasional emails about fundraising and other ways you can help. You can unsubscribe at any time. For more information about how we use your data see our Privacy Policy.
A coefficient of 0 (or 0% in the graph above) represents a scenario where all incomes are equal, while 1 (or 100%) represents complete inequality (where, for example, one person holds all the wealth).
But, since these figures only cover the period to the end of the 2011/12 financial year, we do not know what impact welfare reforms from April 2013 onwards have had on inequality - the IFS has previously warned the impact of these will make it uncertain if the downward trend in inequality will be maintained.
To read more about the causes of the decline in inequality, see our factcheck from last November.