Unequal inequality figures cause confusion
A large number of newspapers and broadcasters ran stories yesterday reporting growing increases in UK and world income inequality.
The reports, following the publication of an OECD study entitled 'Divided We Stand: Why Inequality Keeps Rising', took their cue from a Press Association release.
The much-reproduced PA release contained the statistic that, in the UK, the average annual income of the top 10 percent of earners was 12 times higher than that of the bottom 10 percent. Hence, this is a 12:1 ratio of richest decile to poorest decile in terms of income.
However, Sky News also prominently mentioned an altogether different figure:
Join 74,000 newsletter subscribers who trust us to check the facts
Sign up to get weekly updates on politics, immigration, health and more.
Subscribe to weekly email newsletters from Full Fact for updates on politics, immigration, health and more. Our fact checks are free to read but not to produce, so you will also get occasional emails about fundraising and other ways you can help. You can unsubscribe at any time. For more information about how we use your data see our Privacy Policy.
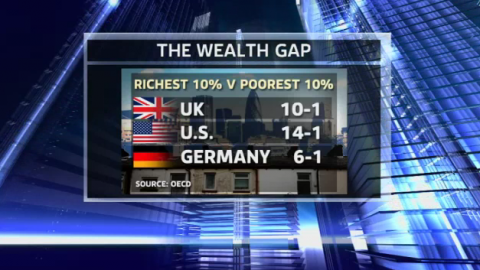
"The wealthiest 10 percent of the population here earns 10 times what the poorest 10 percent earns and that gap is getting wider"
Sky News broadcast, 5 December 2011
More confusingly, Sky News also used the other figure in their online article:
"Research by the Organisation for Economic Co-operation and Development (OECD) showed the wealthiest 10 per cent of the population in Britain earns nearly 12 times what the poorest 10 per cent earns - and it is still rising."
Sky News website, 5 December 2011
A Full Fact investigation found sources for both figures. The 10:1 measure was mentioned in an OECD press release, while the 12:1 ratio came from a country-specific note also published by the OECD.
So why do we have two separate figures from the same organisation, apparently describing the same thing? After contacting the OECD about the different figures, it quickly became clear where the confusion lay.
There are in fact two ways of measuring inequality. One is to take the entire population and compare the incomes of the richest and poorest on these terms. The other is to limit the sample to the working-age population, thus excluding the retired and those that have yet to enter the workforce. Both are statistically acceptable, according to the Resolution Foundation with whom Full Fact consulted at the OECD's suggestion.
The OECD's country-specific note does clearly note the distinction, when it notes that "income inequality among working-age persons" could be described by the 12:1 inequality ratio.
Thankfully, the Press Association also includes this detail in their release, and as a result most newspapers reported the figures correctly. The same cannot always be said of the broadcasters however.
Both the Sky News broadcast and online articles refer to "the population" to describe both the 12:1 and the 10:1 ratio. Given that this accurately applies only to the 10:1 figure, the broadcast itself was correct while the online article is strictly inaccurate.
In a similar vein, the BBC News website also falls into this trap:
"The average annual income for the richest 10 per cent of British people in 2008 was £55,000 - which is 12 times higher than the average for the bottom 10 per cent."
BBC News website, 5 December 2011
This is not an insignificant mistake to make. The Resolution Foundation confirmed that the exclusion of the retired population, who tend by default to have lower incomes, can skew the measurement of inequality by increasing the number of lower incomes relative to higher incomes. Hence reporting one measure and using the statistics for another produces a misleading outcome.