Who benefits most from the Lib Dems' tax threshold change?
Recently the Online Journalism Blog raised the question: "The £10,000 question: who benefits most from a tax threshold change?", prompting much discussion on Twitter between opposing sides of the debate, and on Guido Fawkes' blog.
The essential question is whether the raising of the Personal Allowance from its current rate of £7,475 to £10,000 is a 'progressive' policy, in other words whether the poorest tend to gain more than the richest.
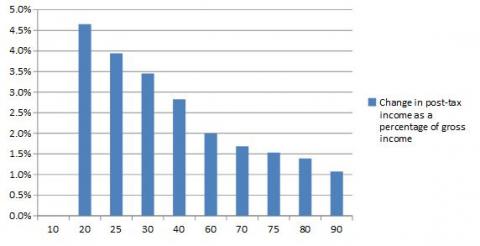
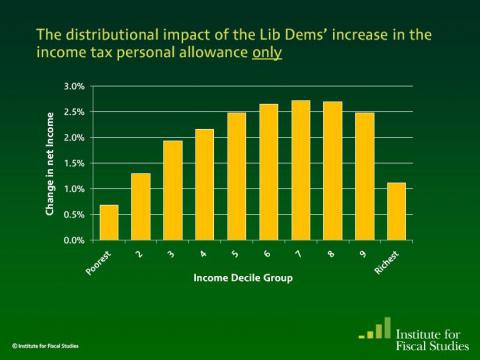
The Online Journalism Blog presents the question with two graphs; one from the Taxpayers' Alliance (TPA) and one from the Institute for Fiscal Studies (IFS).
Here is the TPA's graph:
Join 72,953 people who trust us to check the facts
Sign up to get weekly updates on politics, immigration, health and more.
Subscribe to weekly email newsletters from Full Fact for updates on politics, immigration, health and more. Our fact checks are free to read but not to produce, so you will also get occasional emails about fundraising and other ways you can help. You can unsubscribe at any time. For more information about how we use your data see our Privacy Policy.

And here is the IFS graph:

Looking at both graphs, the statistics appear to be contradictory.
In the TPA graph, while the poorest percentile see no change in their post-tax income, from the 20 to 90 percentiles there are progressively smaller gains in post-tax income. Hence, it paints a picture of a progressive policy after the poorest percentile.
Meanwhile the IFS graph tells a very different story. It suggests that the seventh decile gain most with fewer gains as the deciles approach the poorest first decile. Hence, it paints a picture of a regressive policy up to the seventh decile with some progressivity up to the richest overall.
Two things should be noted straight away. First of all, the IFS graph is from 2010 and is thus based on the previous Allowance of £6,475. It is also the case that the move to £10,000 will not happen instantly and current avalaible data shows it will rise to £8,105 in 2012-13.
Secondly, the difference between the two graphs goes far deeper than the difference between 'post-tax gross income' and 'net income' that is shown on the y-axes of the graphs.
So why are the graphs so different?
The Taxpayers' Alliance argument
The TPA provided Full Fact with the spreadsheet used to generate their data. Their figures were taken from the latest ONS annual survey of hours and earnings which provides data for the annual incomes of ten different percentiles.
In effect, by taking sample 'individuals' from each bracket, the TPA could examine their income and calculate the post-tax change by comparing the current £7,475 Personal Allowance to the planned £10,000 Allowance.
To take an individual with an annual income of £30,000 (70th percentile) for example, with an Allowance of £7,475, they would be taxed at the basic rate of 20 per cent on £22,525 of their income - meaning they lost £4,505 to tax if the policy is considered in isolation. With an Allowance of £10,000, they are only taxed on £20,000 and so lose only £4,000 to tax. Their post-tax income gain is £505.
The Personal Allowance remains at £10,000 for those with incomes up to £100,000, reducing by £1 for every £2 of income above this. Hence, most individuals under the age of 65 in the percentiles provided will gain by £505 from the policy itself.
The IFS have themselves used this calculation before. Prior to the election they commented:
"Those aged under 65 with incomes between £10,000 and £112,950 would gain £705 each (20% tax would stop applying to £3,525 of income — the difference between the current £6,475 allowance and the new £10,000 allowance)."
So, in essence, since £505 is a greater percentage of gross income for those with smaller gross incomes, those individuals gain more from the policy.
The Institute for Fiscal Studies argument
The IFS pointed Full Fact to an election briefing note from 2010 as evidence of their own calculations. Their data came from the Government's own survey of households which contains comprehensive data on household income.
The IFS corrobroate the TPA data in one important sense - that those who do not pay tax anyway (those with incomes below the threshold) will not gain or lose from the reform considered in isolation.
However, where the two organisations differ is in calculating the gains to those already paying tax. The crucial difference is in methodology - while the TPA used individuals as its basis, the IFS used households as provided by the Government data.
This led to substantially different conclusions. The IFS note that using household income as a measure demonstrates increased gains for households with two or more earners. As they state:
"families with two taxpayers would gain more than families with one taxpayer, who tend to be worse off. Thus, overall, better-off families (although not the very richest) would tend to gain most in cash terms from this reform..."
Although they do acknowledge some logic used in the TPA argument:
"...But clearly £705 [based on the Allowance level at the time] would be less valuable to those on higher incomes than to those on lower incomes"
In addition, the IFS commented that those on benefits that are means-tested after tax, such as those on housing benefits, could see reduced entitlements if their income liabilities changed as a result of the policy.
How both arguments compare
Both sides of the debate had comments to make about the other's method. The IFS commented that the TPA's data from the ONS only covered those who had been in work for over a year, thus excluding pensioners and others not in paid work - who would of course not benefit from a higher Allowance. However this does not in itself invalidate the percentiles actually being examined by the TPA.
The main dispute seems to over the merits of using household rather than individual income analysis. While neither side expressed complaint over the validity of using either measure, there were differing perspectives on which provided the best picture.
The IFS commented that household-level analysis accounted for a degree of income-sharing within the household. Hence they further commented:
"It seems odd to describe someone who has no income of their own but is married to a rich person as poor, for example."
However the TPA were concerned that this was less useful because it made assessing an inidividual's situation less important than it ought to be. As they commented:
"If someone earns £12k they are still a low earner even if their spouse makes £50k."
Conclusion
In essence, the distinction emanates from a deadlock of two methodologies - one believing in the primacy of individual analysis and the other seeing more merit in using households as a basis.
In terms of individuals, the policy does appear progressive for the most part as the TPA analysis says. However in terms of households where incomes can be shared, the picture looks somewhat different.
From what we have seen, Full Fact has little reason to doubt the calculations used by either side, and both seem to accurately present different sides of the argument. Which side is more useful is for the reader to decide.