What was claimed
There will be between 700,000 and 2,800,000 fewer jobs as a result of several different options for post-Brexit trade deals with the EU.
Our verdict
There is no evidence for this in the report cited by the claimant, nor elsewhere.
What was claimed
There will be between 700,000 and 2,800,000 fewer jobs as a result of several different options for post-Brexit trade deals with the EU.
Our verdict
There is no evidence for this in the report cited by the claimant, nor elsewhere.
What was claimed
GDP will be between £39 billion and £158 billion less per year as a result of on several different options for post-Brexit trade deals with the EU.
Our verdict
This is based on government analysis comparing 3 hypothetical deals to existing GDP projections, which explicitly can’t be used as economic forecasts and are very uncertain. Were they to be used anyway, these are figures for a 15 year period, not one year.
What was claimed
Options for post-Brexit trade deals with the EU will lead to GDP that’s between 2% and 8% lower.
Our verdict
This is based on government analysis of 3 hypothetical deals, which explicitly can’t be used as economic forecasts and are very uncertain. According to the analysis GDP will continue to grow over the next fifteen years in each case, but more slowly than on existing OBR projections.
This Facebook post—claiming to show the cost of different Brexit deals—has been shared almost 4,000 times.
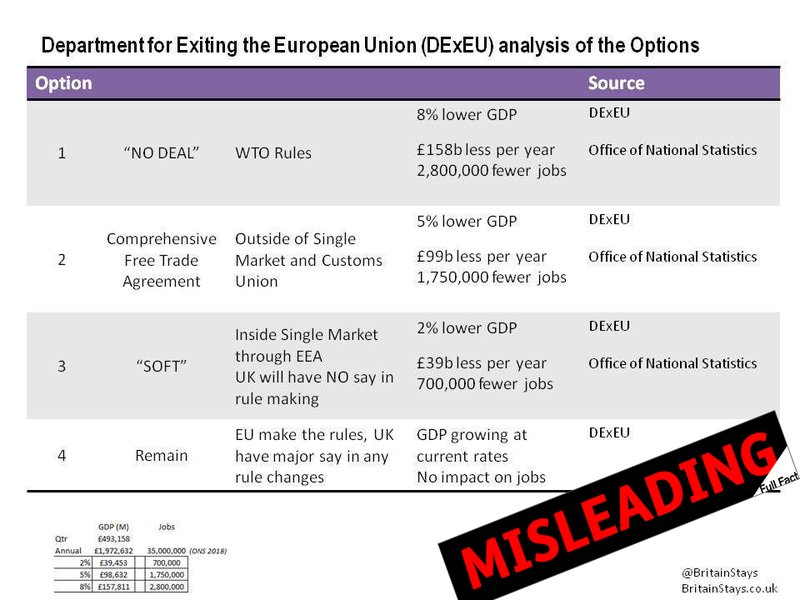
It’s based on government analysis, produced in January 2018, of three fairly broad possible post-Brexit trade scenarios with the EU. The analysis compares how each deal might affect the economy.
Not only is this analysis now over a year old, the graphic’s reporting of it is highly misleading. For a start, the government report explicitly stated that it was based on hypothetical modelling and should not be used to make economic forecasts for each trade deal. This means it can’t be used—as the graphic does—to estimate the future size of GDP, or number of jobs.
Join 73,000 newsletter subscribers who trust us to check the facts
Sign up to get weekly updates on politics, immigration, health and more.
Subscribe to weekly email newsletters from Full Fact for updates on politics, immigration, health and more. Our fact checks are free to read but not to produce, so you will also get occasional emails about fundraising and other ways you can help. You can unsubscribe at any time. For more information about how we use your data see our Privacy Policy.
Even if we ignore this, most of the figures reported by the graphic were still incorrect. The GDP figures were roughly accurate at the time, but the phrasing may have been confusing—the government analysis still expected GDP to grow in each scenario, just more slowly. So “8% lower GDP” under “no deal” meant GDP would still have grown, but more slowly than on the Office for Budget Responsibility’s (OBR) latest economic forecasts at the time, over a fifteen year period.
The “less per year” figures were wrong, as they referred to how much less the economy might grow by over fifteen years, not every year. And there was no evidence for the estimated job losses they reported, in either the government analysis or wider research.
You can read the full assessment we made back in 2018 here.
This article is part of our work fact checking potentially false pictures, videos and stories on Facebook. You can read more about this—and find out how to report Facebook content—here. For the purposes of that scheme, we’ve rated this claim as false because most of the figures are inaccurate, and the accurate ones are presented without important context.
Full Fact fights for good, reliable information in the media, online, and in politics.
Fact checking claims made by politicians, public figures and viral online content can give you the full picture backed by the evidence.
Subscribe to weekly email newsletters from Full Fact for updates on politics, immigration, health and more. Our fact checks are free to read but not to produce, so you will also get occasional emails about fundraising and other ways you can help. You can unsubscribe at any time. For more information about how we use your data see our Privacy Policy.