BBC Question Time, factchecked
Join 73,000 newsletter subscribers who trust us to check the facts
Sign up to get weekly updates on politics, immigration, health and more.
Subscribe to weekly email newsletters from Full Fact for updates on politics, immigration, health and more. Our fact checks are free to read but not to produce, so you will also get occasional emails about fundraising and other ways you can help. You can unsubscribe at any time. For more information about how we use your data see our Privacy Policy.
“There were also millions of people who voted Leave but did not vote for Theresa May's hard Brexit”
Jo Swinson, 27 April 2017
There has been lots of commentary on who voted for each side in the EU referendum and why. We’re focusing specifically here on people’s expectations in relation to a ‘hard Brexit’, as Ms Swinson referred to.
The term “hard Brexit” means different things to different people, but it’s generally used to mean at the very least leaving the EU’s single market (as Ms Swinson referred to).
Theresa May has said this is the only way to control things like immigration. EU officials say this as well. This is because EU free trade rules for the single market require free movement of people between member countries.
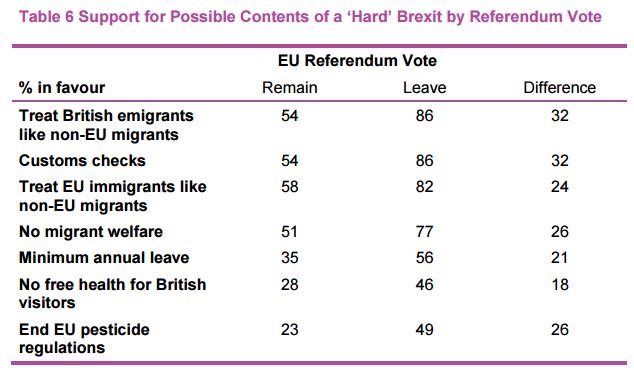
At the start of the year a majority of both Remain and Leave voters said they wanted both free trade and immigration control, says an in-depth study by polling expert Professor John Curtice.
The disagreement comes in what voters prioritise. Faced with a choice over whether free trade or immigration control comes first, as many as 36% of Leave supporters said they would ‘definitely’ or ‘probably’ maintain freedom of movement in return for free trade, compared to 74% of Remain voters, at least when confronted out of the blue by a pollster.
At least half of Remain voters were found to back some policies that the research defined as parts of a hard Brexit as well.
This is all debatable. There is no set definition of a hard and soft Brexit, and we don’t yet know what the trade offs will be during the negotiations.
What this polling does show is that we should beware of making strong claims about what voters on either side think: there are Remainers sympathising with “Leave” positions, and Leavers sympathising with “Remain” positions.
For a broader examination of the reasons behind voters’ decisions last June, social researchers at NatCen have published extensive analysis.
“The average pensioner household now is better off than the average working household.”
BBC Question Time audience member, 27 April 2017
This was the recent finding of a widely reported study by the Resolution Foundation for its Intergenerational Commission. It found that the median pensioner household in Great Britain is now £20 a week better off compared to the median working-age household after housing costs are included. We’ve asked for a bit more detail on this figure.
A much higher proportion of pensioners own their own home (and so face minimal housing costs) than those among the working-age population. For this reason the report points out that average working-age incomes before housing costs remain above those of pensioners.
Pensioners here refers to anyone of State Pension age or over, so some may not be claiming their pension yet and may still be in work.
The Institute for Fiscal Studies had similar findings in 2015 when they said that the median income among pensioners, after housing costs, was 5% ahead of the typical non-pensioner. They put the change down to growing private pension pots and increasing state support.
Higher incomes don’t necessarily mean better living standards
The Intergenerational Commission also cautions against reading too much into whether having higher incomes after housing costs means that average pensioner households have a higher standard of living.
It points to things like the fact that pensioners may experience a higher level of inflation than working-age groups (although it said this hasn’t been the case in recent years). But, it also notes aspects that might push up pensioners’ living standards, such as paying less for things like transport and leisure activities.
“[There has been] a tremendous reduction in pensioner poverty in this country. In the 70s and 80s, 40% of pensioners in this country lived in poverty, that was disgraceful. We've got that figure now right down to 14%.”
Damian Green, 27 April 2017
“There are still 2 million of them that live in pensioner poverty”
Clive Lewis MP, 27 April 2017
Both politicians are talking about the relative measure of poverty and are largely correct, although Damian Green is slightly underestimating the current rate.
Relative poverty compares households’ income to the national average. Anyone who falls below 60% of the median income is defined as in poverty.
An estimated 1.9 million pensioners were in poverty on this measure in 2015/16, out of a total 12 million across the UK. That’s a rate of 16%, and includes the costs of housing, which is the measure preferred by the government and analysts.
That also compares to a rate of 22% for the population as a whole.
You could instead look at absolute poverty, which compares people to a fixed standard of living, adjusted for inflation over time. It puts pensioner poverty slightly lower at 1.6 million and 14%, still including housing costs. Again, that’s lower than the equivalent overall poverty rate of 20%.
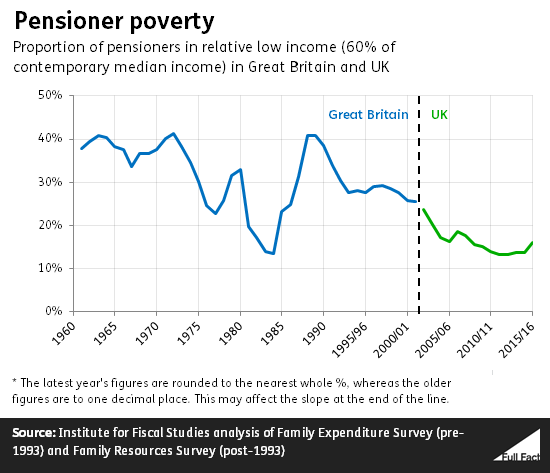
Over the long term, pensioner poverty has fallen. Relative pensioner poverty—the preferred measure for long-term trends—hit 40% at various points in the 1960s, 70s and 80s, according to analysis of official estimates from the Institute for Fiscal Studies.
Since then, it’s been falling almost constantly year on year. The latest estimate puts it at 16%. Damian Green might have been referring to last year’s estimate of 14% when he spoke on the programme.
Back in the 1990s, the absolute and relative poverty rates for pensioners were higher than the average for all households working age households without children; now the opposite is the case, according to the IFS.
Why those huge shifts in the 1980s? Pensioner poverty tends to increase in times of high economic growth, according to past research. That’s because the incomes of people in work can rise a lot faster than prices during these periods, while pensions tended in the past to track prices more closely. That means that, on the relative measure, pensioner poverty can go up simply by virtue of everyone else pulling ahead.
Work and benefits have been drivers of the recent fall
Damian Green mentioned on the programme that the ‘triple lock’ on pensions has been a key driver of falls in pensioner poverty.
The government has actually said as recently as last year that it can’t draw a direct link between the triple lock and pensioner poverty, but that it expected it had an impact.
It’s certainly true that a big part of the general trend is down to pensioner benefits faring better than benefits for working-age people over the last decade, so the triple lock is likely to play a part. The average income from pensioner benefits was down 2.5% in real terms from 2009/10 to 2014/15, compared to a 10.3% fall for working-age families, for example.
Pensioners are also increasingly in work, which is often a way out of poverty. 10% of people over the page of 65 are in work, according to the latest figures from the start of 2017. That was about 7% a decade ago and about 5% back in 1997.
“Since, I think 2010, the number of people relying on food banks has gone up from the tens of thousands to the millions.”
BBC Question Time audience member, 27 April 2017
The number of uses of Trussell Trust food banks has gone up by this much, but we don’t actually know how many unique individuals rely on them.
The Trussell Trust is the largest food bank network in the UK, and it handed out around 41,000 food packs in 2009/10 compared to 1.2 million in 2016/17.
But some people will use a food bank more than once. The Trust says that the average person using a food bank will do so twice in a year, so it estimates that around 590,000 different people used its services in 2016/17.
A 2014 estimate suggested that the Trussell Trust’s food banks account for around half (420) of the food banks in the UK. That suggests the actual number of food parcels handed out across the UK, and the number of users of food banks, will be higher.
The number of food banks has also increased since 2010 so more people have access to a food bank now. That means we can’t be sure that the increasing use of food banks is due to increasing demand. It may be that demand has stayed the same but there are now more services available for people to use. We’re looking into the research that’s been done on this.