BBC Question Time, factchecked
Join 73,000 newsletter subscribers who trust us to check the facts
Sign up to get weekly updates on politics, immigration, health and more.
Subscribe to weekly email newsletters from Full Fact for updates on politics, immigration, health and more. Our fact checks are free to read but not to produce, so you will also get occasional emails about fundraising and other ways you can help. You can unsubscribe at any time. For more information about how we use your data see our Privacy Policy.
“A system where 1% of the population owns 50% of the wealth of the country is demonstrably failing and I don’t think that’s capitalism, I think capitalism has been replaced by something altogether more sinister.”
Arron Banks, 12 January 2017
Even though it’s tricky to estimate what people own, especially the very rich, the claim that 1% of the UK population own 50% of its wealth isn’t supported by the estimates we’ve seen.
Credit Suisse’s Global Wealth Report estimates that the top 1% of the UK owned about 24% of the UK’s wealth in 2016.
In the past, Credit Suisse’s estimates for the UK have been higher than others. In 2011, the Office for National Statistics (ONS) estimated that the top 1% owned about 13% of the UK’s wealth.
Mr Banks may be referring to Credit Suisse’s estimate for the world as a whole. It estimates that 1% of the world’s population own over half the world’s wealth. We’ve looked into this before, and found that a surprising number of households in the UK would fall into the top 1% globally.
“Wealth” in these estimates isn’t just money in the bank. It also includes the value of property, physical possessions, and private pensions.
Measuring wealth is tricky
It’s hard to find out who owns what, and one recent report concluded that our view of wealth in the UK was ‘seriously incomplete’.
Researchers can make estimates based on what’s paid in death taxes and income from investment, as well as household surveys.
It’s difficult to find out about about the wealth of the very rich from surveys because they’re less likely to respond. Some estimates, such as those produced by Credit Suisse, try to account for this by using information from ‘Rich Lists’ like the ones produced by Forbes and the Sunday Times.
Since each kind of source has limitations, researchers tend to say that they should be used to complement each other.
As we’ve said before, wealth isn’t the only measure of inequality that’s available. Inequalities of wealth are higher than inequalities of income, and shouldn’t be taken as a perfect measure of all types of inequality. For example, a recent university graduate may have a relatively high level of opportunity, despite having taken on more debt.
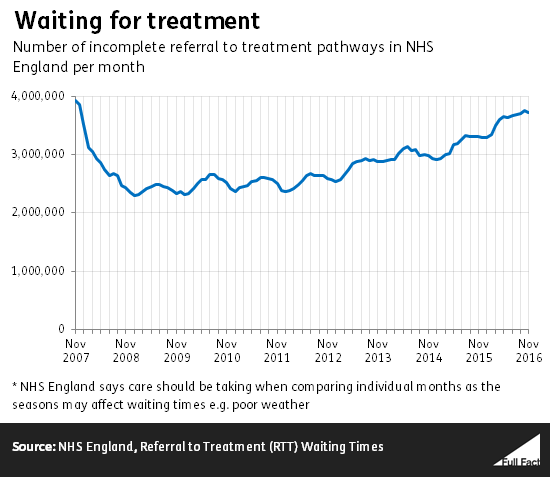
“Four million people are waiting for referral for treatment, that’s getting from the appointment to being treated.”
Paul Mason, 12 January 2017
The latest figures from NHS England show that 3.7 million patient referrals were waiting to be treated as of November 2016.
The figures count each referral rather than individual patients, so if someone was waiting for multiple treatments or was re-referred for a treatment they may be included in the figures several times. NHS England told us that they don’t collect information on how many patients this might apply to.
The NHS’s target is to treat 92% of referrals waiting for “non-emergency, consultant-led treatment” within 18 weeks of them being referred. Just over 90% of those on the waiting list (3.4 million) were still within this 18-week target in November, so for that month NHS England had missed the target.
NHS England says that the impact of hospital trusts which don’t report how many treatments are within target times or not is “generally minimal”.
The remaining 10% (354,000) had been waiting for longer than 18 weeks in November. Of these, around 1,200 had been waiting for longer than a year.
The average length of time patients had been waiting for treatment was six and a half weeks.
Just under 339,000 patients were treated in November. On average they had been waiting for ten weeks since their referral.
“20 hospitals yesterday declared a black alert, so that’s the worst thing you can declare”.
Paul Mason, 12 January 2017
It was reported by the Guardian on Wednesday 11 January that 23 hospitals had declared ‘black alerts’ since the previous Monday.
This mostly refers to hospital trusts reporting a high level on NHS England’s Operational Pressures Escalation Levels (OPEL). This is a series of levels that hospital trusts can say they are at to indicate how much pressure they are under.
OPEL 1 is the least severe and is used when hospitals can “maintain patient flow and are able to meet anticipated demand within available resources… Additional support is not anticipated”.
At the other end of the scale, OPEL 4 is when “organisations [are] unable to deliver comprehensive care” and “there is increased potential for patient care and safety to be compromised”. OPEL 4 also means that external support for the trust is required.
The guidelines also say that “Where multiple systems in different parts of the country are declaring OPEL 4 for sustained periods of time and there is an impact across local and regional boundaries, national action may be considered.”
The Guardian reported that most of the 23 trusts it described as being on ‘black alert’ had actually gone onto OPEL 4. The Department of Health told us that it doesn’t use this phrase.
We’ve asked NHS England whether or not the Guardian’s figure is accurate. The latest published figures are for 7 and 8 January.
On these two days there were no OPEL 4s, but 52 trusts had reported an OPEL 3. This means that the trust was “experiencing major pressures compromising patient flow” and that some outside help might be needed.
Since 31 December there have been 74 hospital trusts which said they were at OPEL 3 or 4 on one or more days. That’s just under half of all trusts in England. Eight of these said they were at OPEL 4.
“If you looks at the sums of money overall, the raw figures for 2015/16, the NHS budget was £98.1 billion, 2020/21 it’s to be £119.9 billion. It is going up.”
David Lidington MP, 12 January 2017
The figures are right, but the rise isn’t as fast as indicated by the claim. It’s also less when the budget is adjusted for inflation, and the claim doesn’t take account of reductions in non-NHS health spending.
The budget for the English NHS was £98.1 billion in 2014/15, and is due to rise to £119.9 billion by 2020/21. These are indeed “raw figures”, in that the natural rise in prices will erode the real value of that money: adjusted for inflation, we calculate that 2020/21’s budget will be more like £111 or £112 billion.
Meanwhile, health spending beyond the NHS is set to fall by £4.9 billion. So the total rise in health spending in real terms will be around £4.7 billion from 2015/16.
We’ve got more details on the money, and whether it’s sufficient, in our article on spending on the English NHS.
"Look at the figures. There are now 11,500 more doctors than there were in 2010, nearly 5,000 more nurses and midwives.”
David Lidington MP, 12 January 2017
This isn’t quite correct, using the most recent comparable figures available at the time. Mr Lidington is overstating the increase in doctors and understating the increase in nurses and midwives.
The best way to compare NHS staff numbers is to take the latest month, and see how that compares to the same month in previous years. That’s because NHS staff numbers are seasonal – they tend to surge in the autumn when new people are recruited. Mr Lidington doesn’t appear to have done that.
Mr Lidington’s office pointed us to NHS England’s workforce statistics as the source of his claim. It looks like he’s comparing the figures for September 2016 with May 2010 – when the Conservatives first entered office. These figures match the ones he’s quoted, but it’s not a fair comparison.
Using the most recent figures Mr Lidington had access to, in September 2016 there were 9,000 more full-time equivalent doctors working for NHS hospitals and community health services in England than there were in the same month in 2010. If we just look at how many individuals are working as doctors, regardless of whether they are full or part-time, the figure is about the same.
Over the same time the number of full-time equivalent nurses, health visitors and midwives increased by about 6,000. There are only about 2,600 more individual people working as nurses and midwives.