BBC Question Time, factchecked
BBC Question Time this week was in Stockport. On the panel were Conservative first secretary of state Damian Green, Labour’s shadow education secretary Angela Rayner, Spectator editor and Daily Telegraph columnist Fraser Nelson, professor of American literature Sarah Churchwell and businesswoman Michelle Dewberry.
Join 74,000 newsletter subscribers who trust us to check the facts
Sign up to get weekly updates on politics, immigration, health and more.
Subscribe to weekly email newsletters from Full Fact for updates on politics, immigration, health and more. Our fact checks are free to read but not to produce, so you will also get occasional emails about fundraising and other ways you can help. You can unsubscribe at any time. For more information about how we use your data see our Privacy Policy.
“And I have to challenge Damian on the fact that more working-class and more disadvantaged people are going to university. Because more people are going to university, but percentage-wise there are less coming from working-class backgrounds, if you take it as a proportion of the percentage of those that are in. And more than ever, people are dropping out of university at record levels, so there is a problem with the current system.”
Angela Rayner
“But what Labour are saying about the number of poor people going to university and how it has decreased, it is a lie”
BBC Question Time audience member
“Let me be absolutely clear I said more people than ever are going to university so therefore more people from disadvantaged backgrounds are going to university. But percentage-wise, in terms of the proportion that was going before, it is decreased compared to the overall number.”
Angela Rayner, 5 October 2017
Confused? So were we. There are so many different statistics on university entrants that it’s possible to find different trends depending on what you’re looking at.
The overall picture is that young disadvantaged students in England and the UK are applying and going to university in record numbers. That increase has slowed in recent years, but the numbers are still increasing.
The question Ms Rayner raises is whether the fact that more young people are going to university generally means a student going to university now is less likely to be disadvantaged than in the past, because the number of disadvantaged students isn’t increasing as quickly. She talked about this in two slightly different ways: in terms of students starting university, and students already at university.
Looking first at students starting university, if you compare to ten years ago the answer is definitely not. If you compare to five years ago, the answer is definitely not. If you compare to two years ago, the answer is that a student now is probably slightly less likely to be disadvantaged. It’s not clear yet whether this is the start a new trend.
Students from areas where people are less likely to go to university have generally made up a slowly increasing proportion of all students going to university. In the past two years the proportion has fallen very slightly, from 10.7% to 10.6%. It’s too early to say what this means, if anything.
Students on free school meals made up 7.3% of young English state school pupils going to university in 2008/09. That figure fluctuated up to 2011/12, and then since then has increased up to 8.5% of state school pupils going to university in 2014/15. More recent UCAS data, which tells us about the gap in the proportion of free school meal pupils and their peers going to university suggests the proportion of new students who qualified for free school meals might have fallen in the last year or two, as Ms Rayner’s office told us.
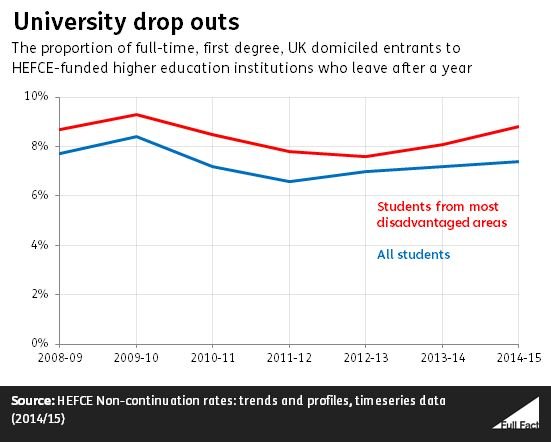
Once disadvantaged students are at university, they are more likely than their peers to drop out.
This doesn’t seem to be outweighing the increasing numbers of disadvantaged students entering university overall. But the only measure we are aware of on this looks only at one measure of disadvantage, and only at full time students starting university for the first time. There is no measure we’re aware of that looks at working class students at university.
It’s not “record levels” dropping out as Ms Rayner claimed. Her office said she meant it was the highest since the higher tuition fees were introduced in 2012.
Ms Rayner’s office made two other points, but neither backs up the specific claim she made.
First, they pointed us to the fall in the proportion of students from non-selective English state schools going to university. An estimated 69% of pupils from non-selective state schools went to university by the time they were 19 in 2010/11. That’s fallen to 61% in 2014/15. But this will include a much broader group than just working class students.
Then they said that there is an increasing gap in access to the most selective universities. This is the case when looking at educational disadvantage, and comparing state schools to independent schools. But this wasn’t the claim being made.
----
One last thing: most of these figures just look just at full-time students, sometimes only those entering university for the first time. Some look just at England, some at the UK. Some look just at 18 year olds, others look at 18 and 19 year olds. We’ve tried to be clear here which we’re referring to.
“In Scotland if you’re from a deprived background you’re half as likely to get into university as you are in England.”
Fraser Nelson, 5 October 2017
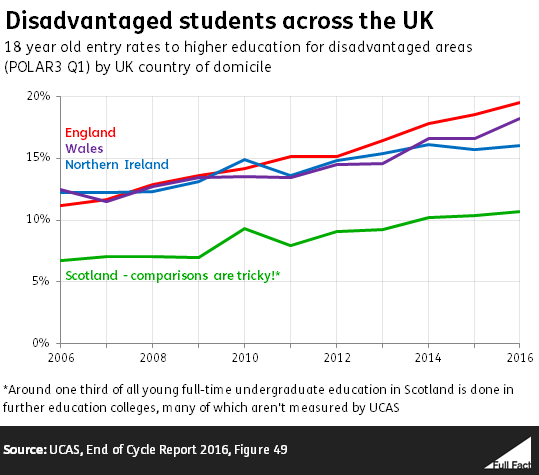
It’s roughly correct to say that 18 year olds from the most disadvantaged areas in Scotland are about half as likely to go to university as 18 year olds from the most disadvantaged areas in England. There are some problems with the way this is measured though which makes the comparison tricky.
About 10.7% of 18 year olds from disadvantaged backgrounds in Scotland went into full-time undergraduate courses compared to 19.5% in England in 2016. Disadvantage here is measured by how many people in the local area a student comes from go to university, rather than other forms of disadvantage.
There are problems with the way this is measured
First, fewer people live in the most disadvantaged areas in Scotland than those in England, which make comparing them tricky. Having said that, UCAS told us that measuring disadvantage in Scotland in other ways it is reasonable to say that students are about half as likely to go to university as their English counterparts. Though this isn’t measuring disadvantage in the two countries in the same way.
Secondly, around one third of young full-time undergraduate courses in Scotland are studied at higher education colleges, rather than universities. Many of these colleges don’t use the UCAS system so aren’t counted here. Students from the most deprived areas in Scotland are also overrepresented in these higher education colleges.
While we can use the UCAS figures to tell us roughly about the likelihood of young Scottish students from disadvantaged areas going to university compared to those in England, they don’t give us the full picture on those doing undergraduate degrees.
We’ve written about this in more detail here.
“And to tackle the housing crisis she’s [Theresa May] not really increased the supply of housing.”
BBC Question Time audience member, 5 October 2017
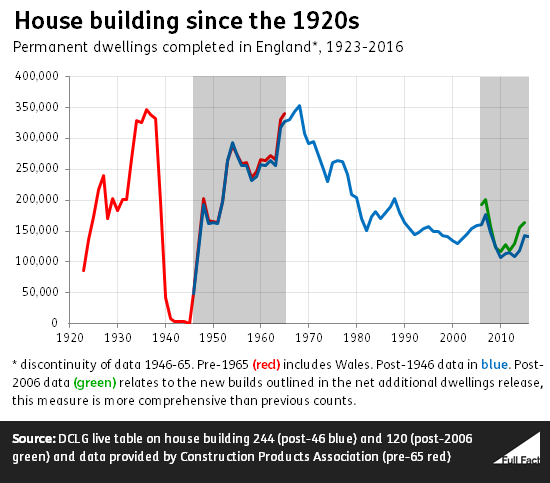
There are several ways of measuring housing supply, but none of them offer a very clear record of how many homes have been built under Theresa May’s government.
The best figures we have for housing supply only go up to March 2016. Theresa May became Prime Minister in July.
Housebuilding can also start under one government and be completed under another, so it is hard to tell how many homes have been built under any one government, and the UK government is only responsible for housing in England.
164,000 new homes were built in England in 2015/16. Once you count things like conversions and demolitions 190,000 homes became available that year, the highest since before the recession.
163,000 homes were started in 2016/17, which is the highest figure since 2007/08. From July 2016 to June 2017 (around the time Theresa May became Prime Minister) 165,000 homes were started. This is the highest figure for the July-June period since 2006/07.
But no recent government has seen enough homes built to keep up with demand.
This is based on two separate projections that England is going to have 210,000 extra households per year between 2014 and 2039, and that 240,000-250,000 homes need to be built each year to keep up with demand.
If this is correct, then the latest figure of 164,000 homes completed in 2015/16 falls well short of the number needed.