BBC Question Time: factchecked
Question Time this week was in Worthing. On the panel were Conservative MP Anna Soubry, shadow Treasury minister Anneliese Dodds MP, author Lionel Shriver, journalist Dominic Lawson from the Daily Mail and Sunday Times, and professor of American literature Sarah Churchwell. We factchecked claims on immigration and wages, whether universities are white and middle class, how much is spent on the NHS and social care and where UK applicants to Oxford university come from.
Join 74,000 newsletter subscribers who trust us to check the facts
Sign up to get weekly updates on politics, immigration, health and more.
Subscribe to weekly email newsletters from Full Fact for updates on politics, immigration, health and more. Our fact checks are free to read but not to produce, so you will also get occasional emails about fundraising and other ways you can help. You can unsubscribe at any time. For more information about how we use your data see our Privacy Policy.
“I agree that unfettered mass immigration has been used to depress wages, especially on the low skill level.”
Lionel Shriver, 24 May 2018
“If you look at the evidence of why we have seen wages going down, there is actually very little evidence that that is being caused by migration, aside from in construction.”
Anneliese Dodds, 24 May 2018
Both panellists hit on a key point: the impact of immigration on wages depends on who you are, what kind of job you do and where you do it. It also might not be the same from year to year.
It is difficult to measure the overall effects of immigration on jobs definitively.
Studies that have tried to do it in the UK have sometimes reached opposing conclusions about whether it increases or decreases wages overall but they tend to agree that immigration has a small impact on average wages of existing workers.
The effects of immigration on workers within specific wage ranges or in specific occupations are more significant. There is quite a lot of evidence that immigration affects low-waged workers the most negatively, and not just in construction.
- Research from University College London finds that an inflow of immigrants the size of 1% of the UK-born population leads to a 0.6% decline in the wages of the 5% lowest paid workers and to an increase in the wages of higher paid workers.
- Similarly, another study focusing on wage effects at the occupational level during 1992 and 2006, found that, in the unskilled and semi-skilled service sector, a 1% rise in the share of immigrants reduced average wages in that occupation by 0.5%.
- An updated version of this study, considering the period between 1992 and 2014, found similar results. This study found that a 1% rise in the share of immigrants reduced averages wages in unskilled and semi-skilled service sector by just under 0.2%.
The available research also shows that any declines in wages are likely to be greatest for resident workers who are themselves migrants. This is because the skills of new immigrants are likely to be more similar to the skills of migrants already employed in the UK than for those of UK-born workers.
Declines in the wages and employment of UK-born workers in the short run can be offset by rising wages and employment in the long run.
Read our full briefing on How immigrants affect jobs and wages, which was written by Oxford University’s Migration Observatory in collaboration with Full Fact.
“The fact is, as anybody who works in higher education, as I do, will tell you. Higher education in this country is blindingly white and it is blindingly middle-class.”
Sarah Churchwell, 24 May 2018
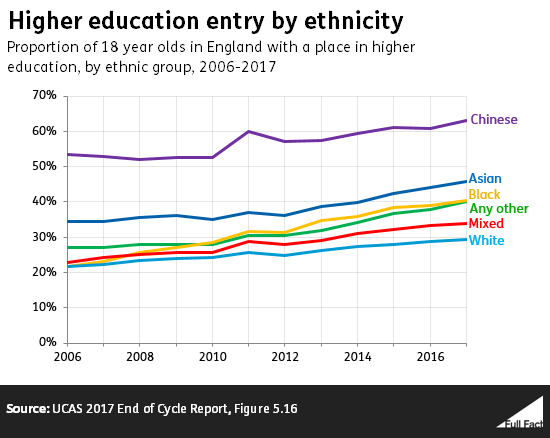
In the UK in 2016/17, 74% of UK-domiciled students in their first year of undergraduate study were white, but at the same time white pupils are the least likely of any ethnic group in England to enter higher education.
A number of measures of social background show that the more disadvantaged your background, the less likely you are to go into higher education. On most of these measures, the gap in access has been falling over time, but remains much higher at the most selective universities.
Ethnicity
In the UK in 2016/17, 74% of UK-domiciled students in their first year of an undergraduate degree reported they were white, according to the Higher Education Statistics Agency (HESA). That compares to 78% in 2012/13.
Among 18 year-olds in England, white pupils are the least likely ethnic group to begin higher education in the UK, according to UCAS. 29% of white 18 year-olds began higher education in 2017.
Class
There are a number of different ways of looking at how many students are entering higher education based on their background and level of disadvantage.
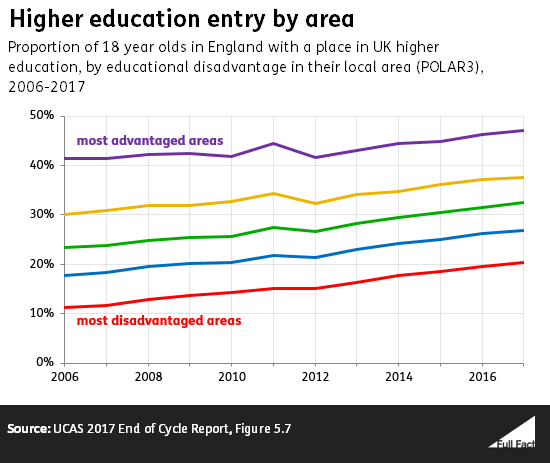
One way to measure this is based on where a pupil lives, and assessing the levels of access to higher education for pupils from that area in the past.
18 year-olds from the most advantaged fifth of areas are more than twice as likely to get a place in higher education as those from the least advantaged fifth. This gap has fallen over time—they were three times more likely to in 2010, and four times in 2006.
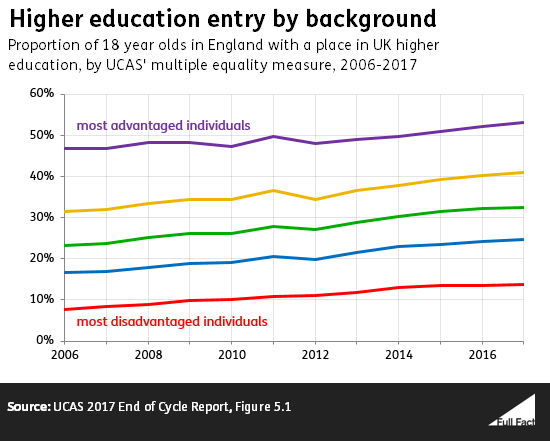
You can also measure disadvantage using a wider range of characteristics, including sex, ethnicity, where pupils live, and whether they were privately educated. It shows a similar trend. The most advantaged fifth of students were four times more likely to access higher education in 2017 than the most disadvantaged fifth. This gap has been narrowing over time, but it has stopped doing so in the last two years.
Based on these measures, the gap between the most and least advantaged students is wider at the most selective universities compared to other higher education institutions. We’ve written more about this here.
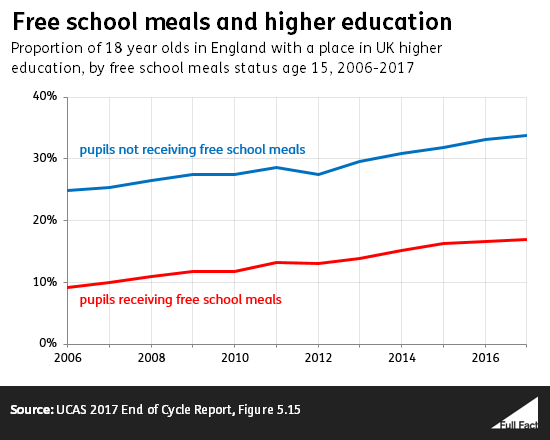
Pupils receiving free school meals at the age of 15 were half as likely to access higher education in 2017 as those who didn’t receive them. The gap had been falling over time, although it has stopped in the last two years.
“The latest figures showed that 28% of boys or girls who applied from the North East, who applied to get into Oxford, got in. 24% of people from London who applied got in. In other words they were more successful per applicant. But only about 700 people applied from the North East, and over 9,000 applied from London.”
Dominic Lawson, 24 May 2018
This is correct. Figures published by Oxford University show that between 2015 and 2017 around 9,200 undergraduate applications were made to Oxford by students from Greater London. Of these around 2,200 offers were made (24% of the total number of applications) and 1,900 students took up their place (21% of the total).
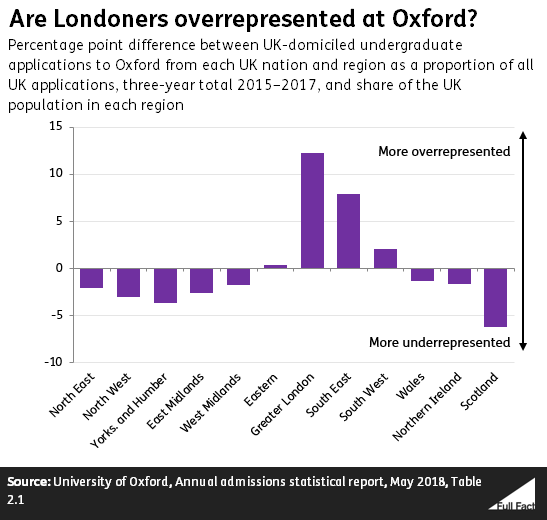
Applications from Greater London made up just over 25% of all applications from the UK in those three years. Meanwhile around 13% of the total UK population lives in Greater London—based on 2011 census figures. This proportion is similar looking at the numbers of 18 and 19 year olds in the UK.
Around 17% of all UK applicants to higher education institutions in the UK were from London in 2018.
Between 2015 and 2017 there were around 700 applications to Oxford from students in the North East of England. Of these around 200 offers were made (28% of the total applications from there) and just under 200 were admitted (25%).
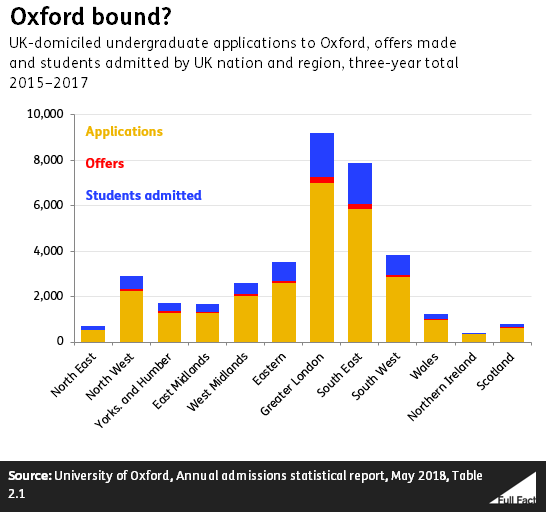
Looking at the difference between the proportion of applicants from each region in the UK and the total share of the UK population that region made up, students from Greater London were most overrepresented among applications and admissions to Oxford, while students from Scotland were most underrepresented.
“We’re spending record levels on our NHS: £149 billion a year. £22 billion on social care.”
Anna Soubry, 24 May 2018
It’s correct that public spending on health across the UK was £149 billion in 2016/17—that’s in today’s prices. Spending on health is at record levels and has increased in most years since 1950.
Health is a devolved area so the UK government is only directly responsible for exactly how money is spent on this in England. The health budget was around £125 billion in England in 2017/18.
Not all of this money is spent on the NHS. For example, some is spent by on things like public health initiatives, education, training and infrastructure. NHS England funding and overall health funding is projected to increase in the coming years, though the amount not spent on the NHS is projected to be lower in 2020/21 than it is now. This includes money announced in the most recent Budget.
Based on current plans, spending per person on health in England is set to increase each year until 2019/20, but in 2020/21 it will fall by 0.01%, according to health experts.
In today’s prices, public spending on adult social care in the UK was £21 billion and £10 billion was spent on children’s social care, in 2016/17.
Public spending on adult social care fell from 2009/10 to 2016/17 by around 10%. We’ve written more about where that money comes from here.