RPI explained: how the government’s choice of inflation measure can make you better or worse off
It was widely reported last week that rail fares will rise by up to 3.2% in January next year. That’s because the government increases rail fares each year in line with inflation from the previous July.
This might seem sensible enough: keeping tabs on inflation has been a vital issue since ancient times. Inflation measures tell us about the cost of living, and how much we need to spend today to be as well off as we were, say, a year ago. They’re used by government (among others) to adjust both the value of benefits we receive (like state pension payments), and the cost of things we buy (like rail fares).
But the government doesn’t use the same measure of inflation for everything. Typically, money that the government pays out (like pension contributions) is set against a measure known as CPI (the Consumer Prices Index). But a few key areas that affect consumer spending, such as rail fare rises and student loan repayments, are set against a measure known as RPI (Retail Prices Index), which is almost always higher than CPI. That means higher costs for consumers.
Whether RPI remains an appropriate measure of inflation is the subject of much debate among statisticians. We’re not trying to bring you the definitive take on which measure is best here (that’s a debate best left to statisticians). But hopefully we can make the issue a little less confusing—and show how government choices about which measure of inflation to use can have a very real impact on the price of your season ticket from St Albans to St Pancras, how much your student loan repayments are, or how much you receive in benefits.
Join 74,000 newsletter subscribers who trust us to check the facts
Sign up to get weekly updates on politics, immigration, health and more.
Subscribe to weekly email newsletters from Full Fact for updates on politics, immigration, health and more. Our fact checks are free to read but not to produce, so you will also get occasional emails about fundraising and other ways you can help. You can unsubscribe at any time. For more information about how we use your data see our Privacy Policy.
What is RPI?
Fundamentally, it’s important to remember that there’s no perfect measure of inflation. What we have is a number of different measures, all of which produce slightly different estimates.
The Office for National Statistics (ONS) measures inflation in terms of “consumer prices”— tracking changes in the value of a sample “basket of goods and services” typically bought by households. The basket is updated as consumer patterns shift. In the simplest of terms, if prices of the goods in the basket go up, then this indicates an increase in the cost of living, and therefore price inflation.
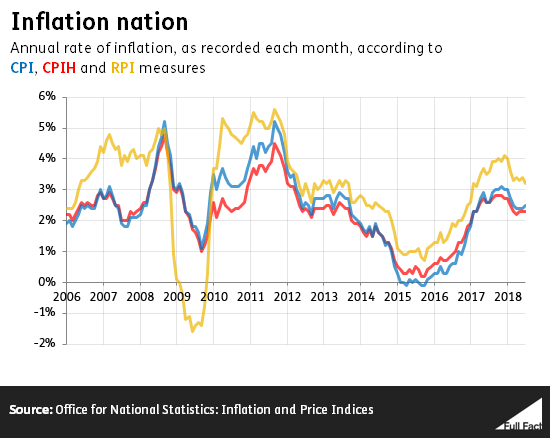
There are three main measures which aim to track the value of a basket of goods: CPI, CPIH, and RPI. RPI almost always estimates inflation to be higher than the other two measures (although during economic downturns, as in the late 2000s, it can flip the other way round and estimate inflation to be dramatically lower).
There have been significant debates among statisticians over which is the best measure, and that debate is something we’ll get on to later.
RPI can’t believe how much the train costs these days
Regardless of which measure you think is best, it’s clear that pegging the cost of something to RPI will generally see it rise faster than if it was pegged to CPI or CPIH.
Late last year, the Royal Statistical Society expressed concern to the Chancellor that the government doesn’t consistently use the same measure of inflation. “All too often”, it says, the government sets payments which people receive (like pensions) against the lower CPI, whilst things that affect people’s outgoings (like the cap on rail fares and student loan repayments) are set against the higher RPI.
The difference between choosing CPI and RPI can have a significant impact on your wallet.
Under government policy, regulated rail fares are increased each January in line with RPI from the previous July. As it was announced last week that RPI for July 2018 is 3.2%, that’s how much certain fares can go up by in January 2019. In contrast, CPI for that month was 2.3%.
An annual ticket from St Albans to London, costing £3,500, could therefore rise by £112 next year. Under CPI, it could rise by £80.50—£31.50 less.
Thinking in the longer term, someone who paid £3,000 for an annual ticket in 2013 could see their fare rise by up to £489 by the start of 2019. Had fare increases been based on CPIH or CPI the maximum rise in that time would have been £170 (CPI) or £140 (CPIH) less. The cumulative impact of fare rises from 2014 to 2019 would be almost £1,600 under RPI, but slightly under £1,100 under both CPI and CPIH.
So choosing RPI can increase costs for commuters. But thinking the other way, the government decision to move benefit increases from RPI to CPI in 2010 means less money for recipients. For instance, state pensions were uprated by 3% for 2018/19 (in line with September’s CPI rate), but they would have risen by 3.9% based on RPI. The full rate for a new state pension would have been worth around £74 more this year were it based on RPI instead of CPI.
Should we say RIP to RPI?
Given that the government measures inflation against CPI in most cases, we’ve asked the Departments for Transport and Education why they still choose to use RPI for rail fares and student loans. The Secretary of State for Transport said last week that he has taken steps to potentially move away from using RPI to calculate rail fare rises in future years, although he says this will mean rail staff’s wages also get set against CPI, rather than RPI.
The House of Commons Library notes that consecutive governments made a policy decision to “shift the burden of funding the railways from the taxpayer to the passenger”, which could explain the reason for using RPI in recent years (from 2003 to 2014 it was RPI+1%), as it allows sharper increases in commuter fares.
More widely, it could be asked both why the government broadly chooses to use the lower measure of inflation, meaning lower benefit increases, and why it doesn’t use the same measure for everything.
Beyond these questions, it’s also important to understand RPI’s wider importance as a measure of inflation in the UK. Introduced in 1947, RPI was for a long time the UK’s only measure of inflation, and its historic value is one of the main reasons why RPI continues to play a prominent role in the UK. Many long-term contracts, and things like gilts and bonds, are still indexed against RPI. Indeed, the National Statistician has noted its “significant value” in this regard, and there is national legislation in place to ensure that the ONS continues to produce RPI estimates for similar reasons.
CPI was only introduced to the UK in 1996, as a harmonised measure used across the EU, and has taken on increasing prominence since then. Of particular note was the government announcing in June 2010 that it would index benefits, tax credits, and pensions to CPI. The Bank of England switched to CPI in 2003.
The statistical debate
There’s also been a lot of debate among statisticians as to how much of a role RPI should continue to play in public life.
The Office for National Statistics has been highly critical of the methodology behind RPI, this year arguing that it’s a “very poor measure of general inflation”. The UK Statistics Authority removed RPI’s status as a national statistic in 2013, and a review it commissioned in 2015 said the formula that RPI uses “should not be used in any index aiming to achieve a good estimate of changes in consumer prices”. Most other countries’ statistical agencies no longer use RPI’s formula.
Yet others have argued that RPI’s limitations have been overstated, and that it should still play an important role. Whether or not it should remain the index for train fare increases and student loans, the point has been made that an inflation index can have many different purposes. Different indices will measure slightly different things, and no one index is perfect for all purposes.
A House of Lords committee is currently investigating whether RPI is an appropriate measure of inflation in the UK, and the Royal Statistical Society continues to debate its value.