How accurate are crowd counts at large events?
When it comes to political rallies, protests or demonstrations, size matters.
In the same way that a ‘sold out’ concert is a badge of honour for any performer, so the number of people attending a rally or protest is a proxy for the wider impact of the gathering. For this reason, Full Fact often finds itself checking competing claims about crowd numbers, and in particular the disparity between the figures supplied by the events’ organisers and those of the police.
Organisers are assumed to have a vested interest in inflating the figures, while the police are repeatedly accused of undercounting.
For example, organisers of the pro-Palestine march which took place in London in November 2023 said that 800,000 people had attended. The Metropolitan Police put the figure at 300,000.
In reality, experts agree that accurately counting the size of a crowd at a non-ticketed event is extremely difficult, if not impossible. This is because the human brain is extremely poor at comprehending large numbers. We are good at comparing—for example we know at a glance which queue for the supermarket tills is longest—but comparing is different to counting.
A number of techniques exist to help estimate the size of a crowd, but none of them are foolproof. Our explainer looks at the science behind the estimates and demonstrates why extremely high numbers—such as claims of millions of attendees—are usually wide of the mark.
Join 73,000 newsletter subscribers who trust us to check the facts
Sign up to get weekly updates on politics, immigration, health and more.
Subscribe to weekly email newsletters from Full Fact for updates on politics, immigration, health and more. Our fact checks are free to read but not to produce, so you will also get occasional emails about fundraising and other ways you can help. You can unsubscribe at any time. For more information about how we use your data see our Privacy Policy.
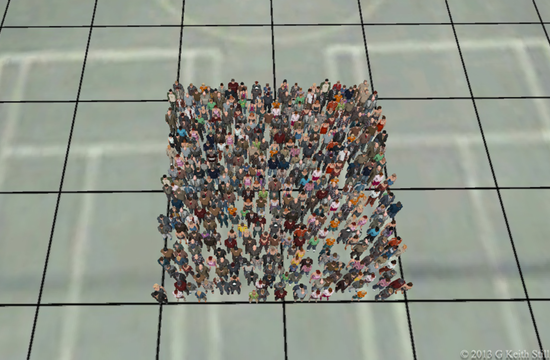
Grid patterns
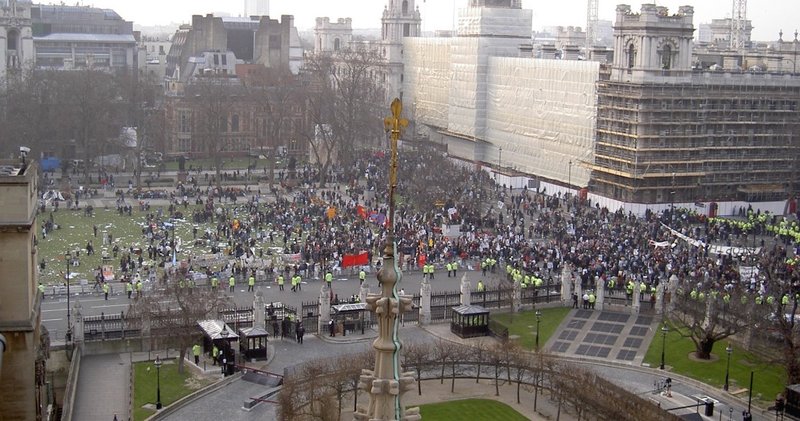
Modern crowd-counting techniques emerged during the 1960s from the work of Herbert Jacobs, a professor of journalism at the University of California, Berkeley. While observing protests against the Vietnam War from his office window, Jacobs noticed the plaza where the demonstration was taking place featured a repeating grid-like pattern.
This meant he was able to count the number of students in a selection of squares to get an average and then multiply that by the total number of squares to get an estimate of the overall size of the crowd.
Jacobs further refined his technique by making an allowance for density, which varied across the plaza. In a light crowd there will be one person per square metre, a dense crowd will have two people per square metre and a heavily crowded area will have four persons per square metre. This last figure is generally referred to as “mosh pit density”.
Technology such as drones and GPS tracking have made it easier to apply the method devised by Jacobs, but the basic principle remains the same. Prof. Dr G. Keith Still, a crowd science expert and visiting professor at the University of Suffolk, told Full Fact he makes use of tools such as Google Earth Pro to measure an area where a crowd has gathered and then uses an average density to estimate the total numbers.
Other ways to estimate crowd numbers include collecting data from mobile phone masts to see how many devices were in an area, but this assumes everyone has a phone with them and has it switched on. There is also specialised computer software that can count the number of heads that appear in photographs of a crowd, but this relies on clear sight lines and angles to maximise accuracy.
There is also an AI tool available within ChatGPT. One user suggests it is accurate to within 10% to 15%, but this will likely improve as it is fed more data.
Density is key
Events at ticketed venues such as Wembley Stadium (up to 25,000 standing) or the main stage at Glastonbury (approx 120,000) can seem extremely crowded, but safety guidance restricts the maximum density and these figures are used to enable a venue to calculate its maximum safe capacity.
Street demonstrations, by definition, are not regulated in the same way, but the same issues with crowd density apply. At four people per square metre—mosh pit density—it’s not possible to move without making physical contact with those around you. At above five people per square metre, it becomes more challenging to move independently.
Crowds above this density can be highly distressing and have a tendency to behave more like a liquid than a group of individuals. This can be seen clearly in footage of the 2005 Oasis concert at the City of Manchester Stadium where a sudden surge in the crowd broke the safety barriers at the front of the stage, forcing the band to temporarily halt the event.
Professor Milad Haghani, an associate professor at the University of Melbourne and expert in crowd dynamics, told Full Fact that he has carried out numerous physical experiments in which he takes large groups of people and gets them to pack together as tightly as possible.
He said: “Momentarily in one round of one trial I managed to get a density of 9 [people per square metre] in one local area ... It’s not possible to get a sustained density of 10 without jeopardising people’s lives.”
Indeed, reports by the Health and Safety Executive found that the crowd density during the Hillsborough disaster where 97 fans died as a result of the crush during the 1989 FA Cup semi-final reached 10 people per square metre.
While crowd size estimates will always vary, understanding there are physical limits to the number of people that can occupy a given space means that, at the very least, it is possible to calculate with some accuracy the maximum number in a particular location.
Another factor to consider is that, according to Professor Still, moving crowds require more space than static ones, meaning that the density of a march will generally be lower than that of a concert.
For organisers, the results of these calculations may be disappointing.
The largest political demonstration in British history is thought to have been the “Stop the War” protest which took place in London in February 2003. This event, which aimed to deter the UK from joining the war against Iraq, had an estimated attendance of between one and two million people, according to its organisers, with police estimating a crowd of around 750,000.
Did three million people attend the ‘Unite the Kingdom’ march in September?
No, not even close.
Back in September we fact checked a claim about the ‘Unite the Kingdom’ march in London, in particular about what the police had said about the number of attendees.
Organiser and far-right activist Tommy Robinson (whose real name is Stephen Yaxley-Lennon) repeatedly insisted that three million people attended the event.
It was reported by some to be the largest “nationalist” demonstration in recent memory, and aerial footage of the event shared by Mr Robinson shows packed crowds filling the streets and stretching off into the distance. This seems to have convinced many that millions must have been there.
However, as Professor Still points out, if you took a road that was 10 metres wide and filled it with three people every square metre, that road would have to be 100km long to accommodate three million people. This would mean the crowd would stretch all the way from Waterloo down to the south coast of England and beyond.
This assumes the crowd maintains the same density throughout the event, but the footage shows several points (for example at 27 and 38 seconds) where the density is light while people were still gathering for the march. Footage shot later in the day suggests higher crowd density in these areas but the crowd occupying a smaller area overall.
For his own calculations, Professor Haghani looked more specifically at the main road occupied by the marchers, which was on average 17 metres wide and occupied a length of 670 metres. To be on the safe side, he assumed a width of 20 metres and a length of 700 metres. He then doubled this area in order to account for the two ends of the march, but stressed that this was a significantly inflated figure for the total area compared to the actual space being utilised.
“For 300,000 people to occupy such an area, the density would have to be 10.7,” he said.
As we have seen, anything beyond a density of six is extremely problematic, and numbers higher than 10 are not physically possible.
Following on from this, to fit three million people into the space occupied by the march, the crowd density would have to be in excess of 100 persons per square metre of space.
Using Professor Haghani’s area calculation and reducing the density to less than six, the figure for the maximum number of people at the event comes to 150,000—the upper limit of the official estimate provided by the Metropolitan Police.
However, Professor Haghani believes even this number is far too high. He took the areas covered by the footage shared by Mr Robinson and broke it down into four areas where the crowd density varied between 1.5 persons per square metre to 3 person per square metre. This resulted in an estimate of between 60,000 and 90,000 for the total crowd. “Nowhere near 3 million or multiple hundred thousand.”
Isolating a 12m by 15m section of Stamford Street, the Professor was able to count only 200 people, meaning the density was closer to 1.1 rather than the 1.5 he had allowed for.
There is, says Professor Haghani, a “classic” optical illusion where footage shot from further away makes things look more crowded than they are. This is most clearly seen in the footage of a seemingly packed Westminster Bridge. “If anyone wonders what a crowd of “millions” on the streets of London would actually look like, here’s a reference point: to fit a single million people, you’d need 40 Westminster Bridges, packed end-to-end and shoulder-to-shoulder with people.”