Some figures from the Autumn Statement—and the facts behind them
What do the stamp duty changes mean?
Stamp duty is currently paid at one rate on the entire sale price of a property. But the Chancellor announced yesterday that it will now operate in a similar manner to income tax.
Until midnight last night, if a house was worth more than £125,000 then the buyer paid a rate of stamp duty on the purchase price. So if a house was worth £250,000 the buyer paid a tax of 1% on the value of the purchase—£2,500. But if the same house was bought for £251,000 then the tax was 3%—£7,530.
If the same principle applied to your wages (ignoring any personal allowance), then getting a pay-rise from £31,865 to £31,866 would see your take-home pay fall from £25,492 to £19,120.
So there's a large incentive for people to buy properties at prices just below the threshold for a given tax band.
Join 74,000 newsletter subscribers who trust us to check the facts
Sign up to get weekly updates on politics, immigration, health and more.
Subscribe to weekly email newsletters from Full Fact for updates on politics, immigration, health and more. Our fact checks are free to read but not to produce, so you will also get occasional emails about fundraising and other ways you can help. You can unsubscribe at any time. For more information about how we use your data see our Privacy Policy.
The new stamp duty works like income tax in that you pay each rate on the part of the sale that falls into that band. So on the £250,000 house you would now pay no tax on the first £125,000, and 2% on the second £125,000, for an unchanged total of £2,500. But on the £251,000 house you now pay nothing on the first £125,000, 2% on the second £125,000 and 5% on the last £1000, for a total of £2,550—a considerable cut.
Under the new system, taxes will be lower or equal to the old system on purchases under £938,000.
The OBR has said this will probably lead to house price increases for lower priced houses, and more sales taking place. For higher priced houses, they predict sales and prices will fall.
Growth in full time jobs, growth in part time jobs
The Chancellor heralded rises in the number of jobs yesterday. But figures for the growth in jobs and the growth in employment aren't the same: some people have more than one job, and some jobs are shared.
The Chancellor mentioned the creation of half a million new jobs over the past year. This actually refers to the growth in employment, rather than jobs, and has been measured from the fourth quarter of 2013 to the third quarter of 2014.
If we take a year to mean the full 12 months before the latest employment figures release, the November release of labour market statistics show that 694,000 more people were in work in July-September 2014 than in the same period in 2013.
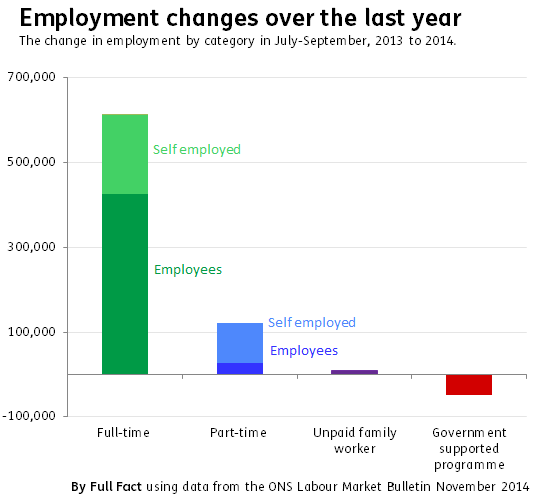
The Chancellor also claimed that 85% of the growth in employment over the past year has been in full-time work.
We've taken a look at the data sources used by the treasury, and it looks to us like this figure refers to August 2013 to August 2014.
These full-time and part-time figures would include people working unpaid for a family firm, and people who are only employed on government supported training and employment programmes.
Outside of these categories, about 612,000 people were added to full-time employment and about 121,000 people were added to part-time employment—a ratio of 5:1.
The lowest ever gender 'pay gap'
The gap between men's pay and women's hourly pay in April 2014 was 9.4% for full-time workers, compared with 10% in 2013. This is the lowest on record (when comparable measurements of pay have been used).
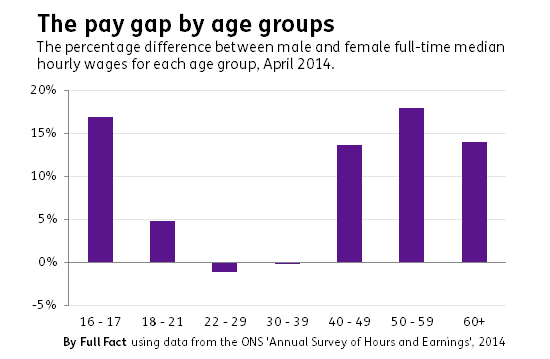
It's measured by comparing how much the median or 'middle earning' man in full-time employment earns per hour compared to the middle earning woman in full-time employment. This doesn't mean that men and women earn different amounts for the same work.
The 'pay gap' isn't uniform across all age groups and regions: it actually becomes negative for full-time workers between 22 and 39. So the median woman earns more per hour than the median man does in these age groups. However, because men work more hours (and more overtime) on average, median male weekly earnings are higher than median female weekly earnings within these groups.
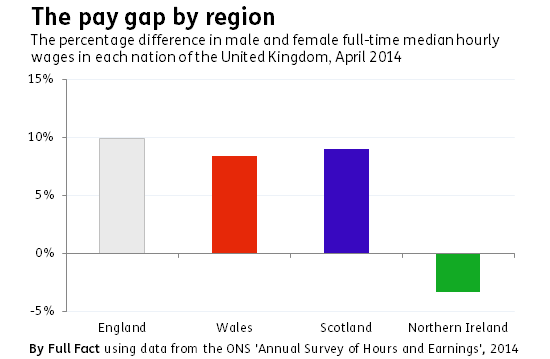
The gap also varies across regions: the median woman in full-time employment in Northern Ireland earns more each hour than the median Northern Irish man in full-time employment. This gap grew from by 1.8 percentage points in the past year.
Workers are £1,600 worse off under this government
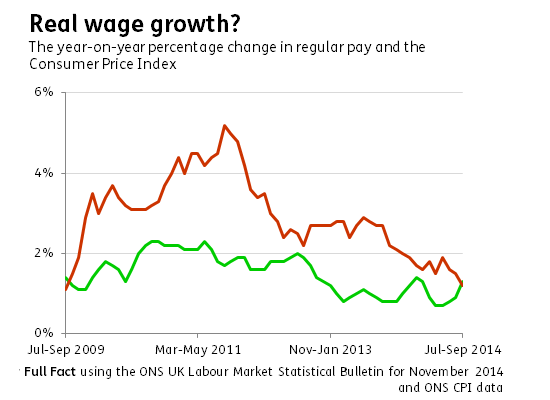
After the statement, Shadow Chancellor Ed Balls responded by bringing up the cost of living crisis. We covered an identical claim to the one above last year. At that point, the failure of wages to grow in line with inflation meant that the average worker was earning about £1,600 less in real terms than they were in May 2010.
But the measure of inflation (the Retail Price Index or RPI) used to calculate this has lost its status as a national statistic. Using a different inflation measure (like the Consumer Price Index or CPI) will give a different change in real income. Comparing wage growth with growth in the CPI would have given a smaller fall in real income of £1,150.
This still shows that real earnings fell consistently from 2009 to 2014.