2016 saw the steepest fall in university applications for 30 years.
Our verdict
This is wrong. In 2016 the number of applicants to UK universities fell slightly, but not by as much as they did in 2012, following the increase in tuition fees. The number of applications to UK universities (which doesn’t include applications made after the June application deadline) rose in 2016. The number of applicants for 2017 (reported after 15 January deadline) showed a fall of 5%. This is the second largest of three falls since 2002.
What was claimed
In 2016 and 2017 the number of students applying from lower waged families has fallen.
Our verdict
Application rates by disadvantaged young students and entry rates by young pupils from lower waged families haven’t fallen, according to UCAS.
What was claimed
The percentage of state school students applying to university has fallen.
Our verdict
UCAS don't publish figures on this. The figures we do have may be affected by local authority led schools becoming academies.
Labour has claimed that university applications have fallen. Labour politicians say that in particular, it is “disadvantaged” pupils, “state school” pupils, or children from “lower waged” families who are being put off.
We’ve asked Labour for the sources of these claims, and haven’t been given an answer.
In 2016 the number of applicants to UK universities fell slightly, but not by as much as they did in 2012, following the increase in tuition fees. The number of applications to UK universities (which doesn’t include applications made after the June application deadline) rose in 2016. The number of applicants for 2017 (reported after 15 January deadline) showed a fall of 5%. This is the second largest of three falls since 2002.
UCAS don't publish figures on what percentage of university applications come from state school pupils (as was referred to in the claim). The figures we do have may be affected by local authority led schools becoming academies.
As far as we can see it’s wrong to say there has been any fall in the number of English applicants from disadvantaged backgrounds. The number and rates of young people applying and going to university, including disadvantaged or “lower waged” young people, have continued to increase.
We’re focusing here on the numbers of people living in the UK applying to university in the UK. When figures are only available by each country of the UK, we have focused on applicants in England, as that is where we’ve seen the recent increases to tuition fees and changes to student finance.
Join 72,547 people who trust us to check the facts
Subscribe to get weekly updates on politics, immigration, health and more.
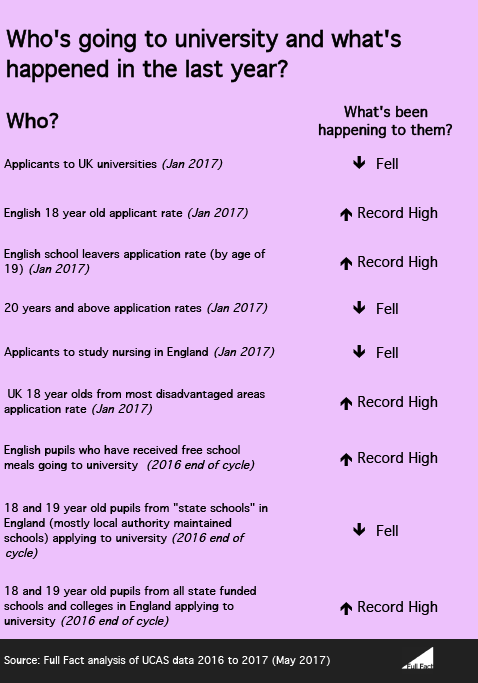
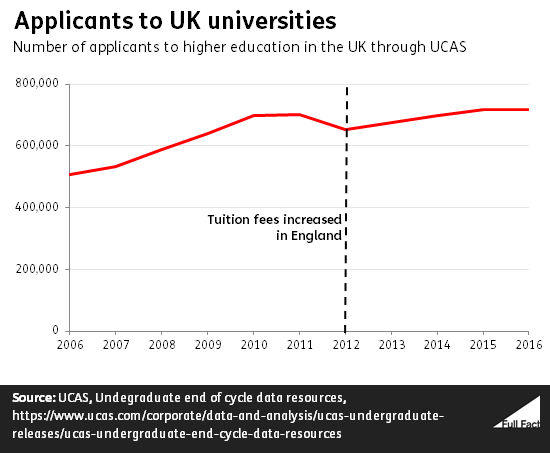
The total number of university applications to the UK rose in 2016 but the number of applicants fell slightly
“Last year saw the steepest fall in university applications for 30 years.”
UCAS publishes data for both the number of applications by UK applicants and the number of applicants.
In 2016 the number of applicants to UK universities fell slightly from 2015. The number of applications to UK universities rose in 2016, but that doesn’t include applications made after the June application deadline. The January deadline for 2017 shows that the number of applicants to UK universities fell by about 5% compared to the same time in 2016.
Since applicants can make up to five applications, it’s probably more useful to focus on applicant numbers.
The 2017 fall in total number of applicants was the second largest of three falls since 2002 but it’s harder to compare further back than this, according to UCAS.
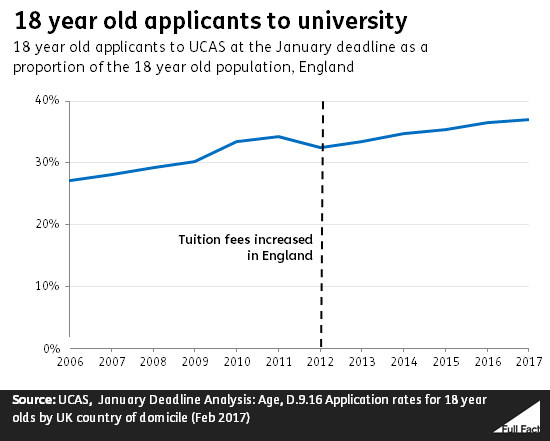
The number and rate of young people applying has continued to increase
18 year old applicant numbers have continued to increase.
Application rates for 18 year olds in England reached a record high of 37%bythe2017Januarydeadline, although this is a smaller increase than seen in previous years.
Application rates refer to how many from a certain group apply to university. Generally rates are more useful in this area because they aren’t influenced by changes in the overall population.
For English students leaving school in 2016 their application rate was the highest ever recorded at 45% (including applications by this group in 2016 and 2017).
Application rates for older age groups and particular subjects have fallen
Application rates for all older age groups in England, aged 20 and over, have fallen, and by an amount comparable to the drop for all age groups seen in 2012.
Particular subjects have seen larger falls too. The number of applicants from England studying nursing fell by 23% in 2017. UCAS says this is the, “most noticeable decrease,” it has seen.
The Royal College of Nursing blames the fall in nursing on the removal of grants for students studying nursing.
For older applicants, the fall is probably the result of several factors, according to UCAS— more people going to university when they are younger, higher employment rates, a higher minimum wage and other educational opportunities such as apprenticeships.
As for the fall in the total number of students applying to university, some suggest the increasing cost of university is beginning to put off students. In 2017 the cost of tuition fees will go up for the first time since 2012.
It’s too early to say if the recent fall in applications reflects a shift in the longer term trend, which has generally been one of increasing numbers of people continuing to go to university.
The number of disadvantaged students applying hasn’t fallen according to UCAS’ measures
“This year and last year we’ve seen the number of students applying from lower waged families has actually gone down”
Shadow Education Secretary Angela Rayner also made a similar claim on BBC Question Time, where she seemed to say the number of disadvantaged students going to university has fallen.
As far as we’re aware, there haven’t been any falls in UCAS’ published measures of “lower-waged” or disadvantaged students.
The number of 18 year olds living in the most disadvantaged areas in the UK applying to university has been increasing.
So has the rate. 22.1% of 18 year olds living in the most disadvantaged areas in the UK applied by the January 2017 deadline, up from 21.7% in 2016, and from 20.7% in 2015.
The sameis true of people living in England specifically.
The other measures we’re aware of to look at students from low wage families relate only to the rates of young people going to university (so these are effectively a year behind the application figures).
These are all still at record highs, although there has been some levelling off in the growth in the past year or so.
The rates of disadvantaged young people going to university (both at the age of 18, and for school leavers) has continued to increase.
The entry rate for state school pupils in England who received free school meals at the age of 15 has continually increased, and is now at a record high of 16.1% (in 2016, up from 15.9% in 2015 and 14.7% in 2014).
The entry rate among 18 year olds in England who UCAS identify as being least likely to enter higher education, based on things like their ethnicity and where they live, has continued to increase too. It is now 13.6% in 2016, up from 13.5% in 2015, and 13.1% in 2014.
Numbers applying from “state schools” has fallen, but not from all state-funded schools
“I know what people are saying about the issue of tuition fees, but we’re just seeing for the first time, because the Tories increased tuition fees from 3,000 to 9,000 pounds we’re just seeing state children, the percentage of state children declining.”
The number of 18 and 19 year olds from schools defined in UCAS’ figures as “state schools” who applied to university has fallen between 2015 and 2016 in the UK, and in England specifically.
But we can’t read too much into this without more information.
This category excludes many state funded schools and providers, as academies, grammar schools, sixth form colleges and further education providers are all counted separately.
Schools decide their own category into the UCAS system, so UCAS said schools counted in the “state funded” category will be state-funded ones that didn’t identify with any of the other categories. UCAS said it would “typically” refer to local authority maintained schools.
With growing numbers of schools becoming academies, we know that at least some schools will have moved their self-categorisation from “state school” to “academy”.
Unfortunately UCAS doesn’t publish information on the proportions of state school students applying to university, so we can’t take account of potential underlying changes to the total number of pupils at each school type.
What we can say is that including all state-funded schools and colleges (everything but “independent” schools in UCAS’ statistics), the number of young applicants continues to increase in the UK and in England.
Correction 2 June 2017
We originally wrote that the number of university applications by UK students fell in 2016 when the number actually rose. We’ve corrected references to this in the text and infographic.