Did 2011 see the most working days lost to strikes in decades?
"The number of working days lost to industrial action soared to its highest level in decades last year"
"1,389,700 working days were lost in 2011"
Daily Mail, 16 August 2012
The past year or so has seen a resurgence of worker activism with multiple unions electing to strike over issues such as pensions reform, wage reductions and job cuts. But just how militant are contemporary workers by historical standards?
Join 72,953 people who trust us to check the facts
Sign up to get weekly updates on politics, immigration, health and more.
Subscribe to weekly email newsletters from Full Fact for updates on politics, immigration, health and more. Our fact checks are free to read but not to produce, so you will also get occasional emails about fundraising and other ways you can help. You can unsubscribe at any time. For more information about how we use your data see our Privacy Policy.
Today the Mail reported on official figures which supposedly revealed that "the number of working days lost to industrial action soared to its highest level in decades last year"; a claim that Full Fact was keen to look at a little more closely.
Analysis
The Mail sourced its figures to an Office for National Statistics (ONS) report released yesterday.
A flick through the report's introduction reveals that in 2011 1,389,700 working days were lost to labour disputes in the UK, the highest figure since 1990, thereby substantiating the Mail's claim.
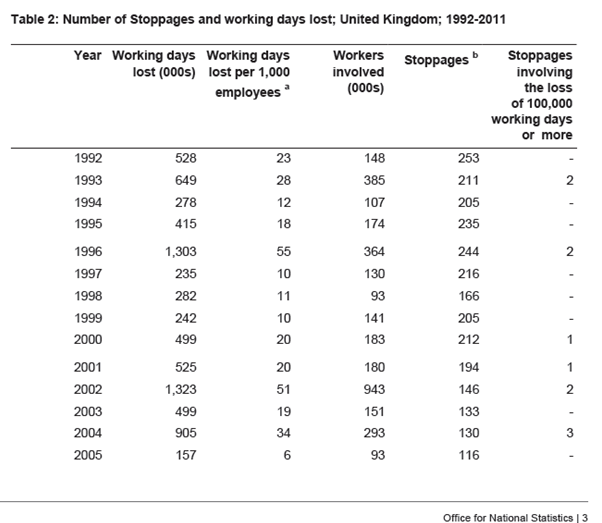
The table below (taken directly from the ONS report) presents data for the past 20 years. We also used the data to construct a graph for the working days lost since 1992.

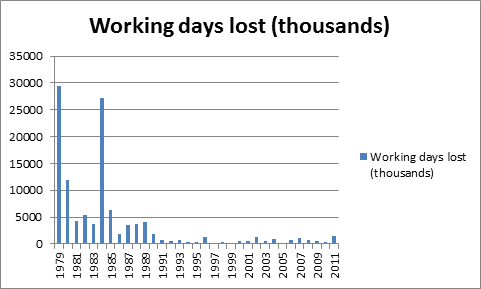
Regular Full Fact readers will note that our previous Factcheck on this issue included figures dating back to 1979 but that this data is not in the latest ONS report.
In the interests of consistency, we went to the ONS raw data and constructed the graph below:

How useful is the measure of 'working days lost'?
The brief analysis above reveals that 2011 did have the highest number of working days lost to industrial action in recent years - although even this is eclipsed by the days lost in some of the 1970 and 80s.
However, this is not necessarily the best way of gauging worker activism over time as the number of workers is likely to vary with demographic and economic change.
As such, the ONS also publishes the number of working days lost per 1000 employees which can also be found (from 1992 onwards) in the table above.
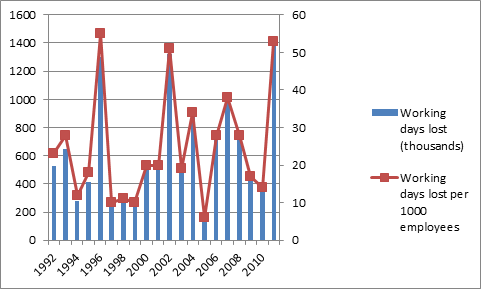
A quick glance reveals that, although the number for 2011 is reasonably high, it is not the highest in the time period since 1992.
The graph below illustrates that although the number of working days lost per 1000 employees follows the general trend of the total days lost, the fit is not perfect and thus one should be wary of drawing too many conclusions from the number of working days lost alone.

[left hand axis: days lost, right hand axis: days lost per 1000 employees]
Conclusion
We can confirm that 2011 saw the most working days lost to industrial action since 1990, thereby substantiating the Mail's claim.
We would, however, caution against using this statistic alone to gauge levels of overall worker activism, given that the rate per 1000 employees accounts for changing numbers of employed people overall.