Bad graphs: Ofcom's news overload
Last week Ofcom published its latest research looking at our attitudes to the broadcast media, including where we get our news from.
One graph was a little hard to handle:
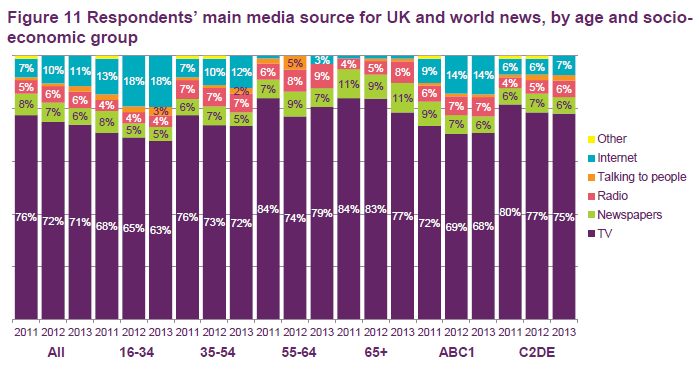
It's saying all sorts of interesting things, but it's difficult to see them. For example, it shows TV is still a dominant source of news, but it's steadily declining across almost all groups of people - most noticeably against rises for the internet among young people and people in higher social grades.
Join 74,000 newsletter subscribers who trust us to check the facts
Sign up to get weekly updates on politics, immigration, health and more.
Subscribe to weekly email newsletters from Full Fact for updates on politics, immigration, health and more. Our fact checks are free to read but not to produce, so you will also get occasional emails about fundraising and other ways you can help. You can unsubscribe at any time. For more information about how we use your data see our Privacy Policy.
There's also more to this graph than meets the eye. While the bars looks like they all add up to 100%, they don't. 'Other' doesn't actually cover all the other categories. Some respondents said they don't get or watch news. Others say they don't know. This amounts to as much as 7% of young people aged 16-34, but they're hidden by the graph.
It would have been better had the regulator made some of this clearer, for instance by stating that the 'respondents' were those who'd given a definite answer and adjusting the percentages accordingly.
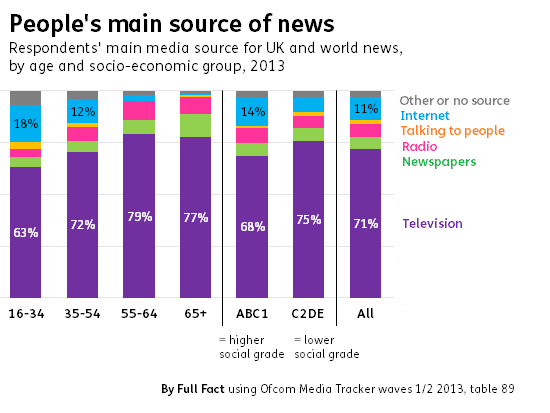
We've knocked up our own version. There's less information in it, but the material that is there is easier to digest.