Has long-term youth unemployment soared by 900 per cent in 12 years?
The Sun, 19 June 2012 (also in Daily Star)
Ahead of tomorrow's release of the latest labour market statistics from the Office for National Statistics (ONS) the Trades Union Congress (TUC) decided to join the debate today by highlighting a dramatic increase in long-term youth unemployment.
The TUC's claim, which was reported in the Sun, showed that the number of young people out of work for more than a year has increased by a factor of 10 since the year 2000.
But is this true?
Join 74,000 newsletter subscribers who trust us to check the facts
Sign up to get weekly updates on politics, immigration, health and more.
Subscribe to weekly email newsletters from Full Fact for updates on politics, immigration, health and more. Our fact checks are free to read but not to produce, so you will also get occasional emails about fundraising and other ways you can help. You can unsubscribe at any time. For more information about how we use your data see our Privacy Policy.
Analysis
Full Fact is no stranger to claims about long-term youth unemployment, and long-term readers may be aware that there are several ways in which it can be measured.
In the TUC's case, they helpfully provide all the necessary details in their own press release, which makes clear they are looking at 18-24 year-olds who have been claiming Jobseeker's Allowance (JSA) for over one year.
Known as the claimant count, these figures are readily available on the ONS website or via their nomis service, although as we shall see, they are not the only or even necessarily the best way to measure unemployment.
Taking these figures at face value, we can see what the TUC is getting at. In April 2012, 60,955 young people had been claiming JSA for at least a year according to the statistics. Comparing this to the data for April 2000 - when only 6,260 were claiming JSA - represents an increase of 874 per cent.
So can we conclude the TUC are right to say that long-term youth unemployment has increased by a factor of 10 since 2000? Unfortunately, that's where the problems start...
Not the only measure
While the claimant count is a perfectly valid reflection of the number of people claiming Jobseeker's Allowance, this doesn't necessarily reflect the total number out of work, as some will not be eligible for or may choose not to claim the benefit.
For this reason, the ONS also publishes unemployment figures derived from the Labour Force Survey, which reports the number of ecnomically active people currently out of work. (Economically active people are those in work or seeking work.)
On this measure, using the same age groups and duration, the growth has been more modest. The most recent data for January to March 2012 shows just under 232,000 18-24 year-olds were unemployed for more than a year, up from just under 57,000 in the same period in the year 2000.
This represents a still-considerable 307 per cent rise on 2000. But if we put the two unemployment indicators together to see how they have changed, an even more interesting picture emerges:
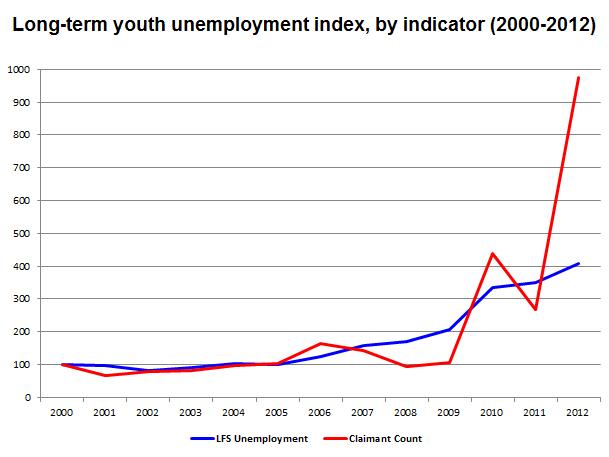
The TUC's 873 per cent (which appears at 973 on this index measure) claimant count increase is obvious from the graph, as is the 300 per cent increase in the LFS unemployment measure.
What is remarkable however is the volatility in the claimant count since 2009. So why might this be the case?
The young people not counted
One reason for the dramatic variation in the claimant count figures since 2009 is the impact of policy changes in the Government's work programmes. As a parliamentary briefing note details, a lot of this is down to whether or not young people out of work are required to move off JSA after prolonged periods of unemployment.
From 1998 to 2009 (the 'stable' period in the graph) the New Deal for Young People introduced an effective upper limit on the duration of JSA claims by 18-24 year-olds. Those remaining on the benefit at 10 months moved into either training or work experience, thus removing them from the long-term claimant count statistics.
However policy changes more recently, under the Flexible New Deal and the more recent Work Programme, relaxed the requirements for young people to move off the benefit after long periods, and under the Work Experience programme participants remain in receipt of JSA while on their placement.
Full Fact has explored recent claims by the Work and Pensions Secretary, Iain Duncan Smith, that this amounts to 'statistical tampering' by the previous Labour administration to make it appear as if there are fewer people unemployed than is actually the case.
The Centre for Economic and Social Inclusion (CESI), offers its own analysis of the recent unemployment statistics. They brought to our attention statistics from back in 2000 on those who left JSA under the New Deal:
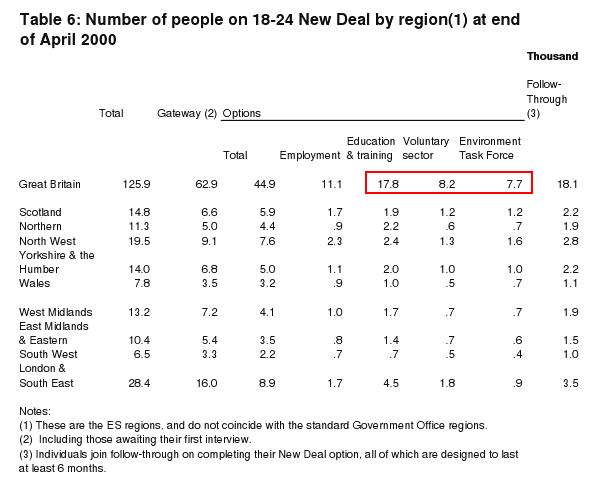
These figures show that around 33,700 18-24 year-olds in April 2000 were on the New Deal programme, and thus invisible to the claimant count statistics.
Obviously we cannot say how many of these young people would otherwise have appeared on the long-term unemployment measures.
However, it is worth pointing out that if these young people were added to the April 2000 claimant count statistics, the TUC's 300 per cent increase would look more like a 50 per cent increase (bearing in mind this is likely to be at the lower end of estimates if we try to account for the New Deal effect)
Conclusion
While there is nothing to fault the TUC's statistics showing a 900 per cent rise in the long-term youth claimant count since 2000, this isn't necessarily a particularly useful measure to use.
Part of the reason behind the dramatic rise in the number of young people on JSA long-term in the last few years can be put down to government policy changes. Specifically, the low levels of long-term claimants in the early 2000s could be partly due to the duration restrictions imposed by the New Deal.
Furthermore, the LFS unemployment indicator shows a more modest rise in unemployment than implied by the claimant count upon which the TUC relies. So the '900 per cent' rise in unemployment cited by the TUC could well exaggerate their own case.
Update (6 July 2012)
Chris Bryant, Labour MP for Rhondda claimed in an Independent article this morning that the number of young people out of work for more than a year in his constituency had risen by 775 per cent in a single year.
He correctly refers to statistics for Jobseeker's Allowance from the nomis database which show the number of people in his constituency under the age of 24 claiming for over a year has risen from 20 in May 2011 to 175 in May 2012.
His figures closely follow the national trend discussed in this article. Unfortunately, the same caveats apply. Mr Bryant's startling figure doesn't necessarily provide us with the clearest picture considering the large effect recent work experience policy changes have had on claimant count statistics.