Prime Minister's Questions, factchecked
Join 73,000 newsletter subscribers who trust us to check the facts
Sign up to get weekly updates on politics, immigration, health and more.
Subscribe to weekly email newsletters from Full Fact for updates on politics, immigration, health and more. Our fact checks are free to read but not to produce, so you will also get occasional emails about fundraising and other ways you can help. You can unsubscribe at any time. For more information about how we use your data see our Privacy Policy.
“We have been putting more money into social care and health”
Theresa May, 14 December 2016
“The Prime Minister doesn’t seem to be aware that £4.6 billion was cut from the social care budget in the last parliament”
Jeremy Corbyn, 14 December 2016
It’s correct that spending on adult social care fell in the last parliament according to analysis from health experts the Nuffield Trust, Health Foundation and King’s Fund.
By contrast, funding is expected to rise in this parliament, taking inflation into account, although not until 2017. That said, the same experts warn this won’t be enough to make the system sustainable.
Mr Corbyn is referring to day-to-day spending by local councils in his claim, using estimates from the Association of Directors of Adult Social Services (ADASS).
An ADASS report in June 2015, based on a survey of its members, claimed that there had been a £4.6 billion reduction in adult social care budgets between 2010/11 and 2015/16.
It only put £1.6 billion of this down to cash reductions. The balance was down to more older and disabled people needing care (£1.75 billion) and price pressures (£1.25 billion).
We’re looking in to the figures in more detail and will update when we know more.
Mrs May, meanwhile, is talking about more recent changes to funding. In 2015 the government announced changes, including a ‘social care precept’ allowing councils to raise council tax by up to 2% a year to fund social care, and putting more central government money into the ‘Better Care Fund’ designed to help the NHS and councils coordinate social care.
Projections suggest spending will rise over this parliament, although that depends on how much councils decide to and manage to raise.
Correction 16 February 2017
We’ve changed our conclusion from “Correct according to the Association of Directors of Adult Social Services”. This overstated what we knew at the time about the research behind the figure, and didn’t address what the £4.6 billion represented. We’re looking in more detail into the figure and we’re hoping to update the article when we know more.
“The £2.5 billion shortfall in social care funding”
Tim Farron MP, 14 December 2016
“The shortfall in social care funding by 2020 is estimated at about £2.5 billion a year"
Philip Davies MP, 14 December 2016
It’s correct that there will be a shortfall in social care funding of around this much, according to several different expert estimates.
The Liberal Democrat press office told us that this particular figure comes from the Local Government Association, which is predicting that adult social care will need £2.6 billion more by 2020.
That £2.6 billion is made up of an immediate need and some projected costs. It estimated a £1.3 billion gap between what care providers say they need and what councils spent last year, and another £1.3 billion for extra costs due to inflation, an aging population and the new National Living Wage rate of £7.20.
The LGA says it takes into account the government’s promises of extra funding through the Better Care Fund and the optional council tax rise, but not other potential pressures from policy changes or unmet needs.
A group of leading health charities calculated a similar figure. It compared projected needs with projected spending and found a gap of at least £1.9 billion in 2017/18 and £2.3 billion by 2020.
Similarly, the Association of Directors of Adult Social Services says that the additional funding gap by then will be £2.9 billion.
“The difference between the worst performing council in relation to delayed discharges and the best is a 20 fold difference. That’s not about the difference of funding, it’s about the difference of delivery.”
Theresa May, 14 December 2016
It’s not immediately obvious what time period, or even how many councils are being referred to here. It’s a claim the government has made in various forms before.
We’ve done our own estimates based on figures for last year in the English NHS, and this claim seems to be in the right ballpark.
We’ve asked the Department of Health how the figure is calculated.
Best vs worst
There are two ways to measure the delays to hospitals and patients caused by discharges.
Based on everything the government has said it seems to be referring to the 10% of local authorities with the lowest number of delayed bed days attributed to social care and the 10% with the most.
Figures are available which give the average daily rate of delayed transfers of care from hospital per 100,000 people over 18 in each council area.
Using this measure the 10% of councils with the least delayed bed days had a rate of 0.5 delays per 100,000. The 10% of councils with the most delays had a rate of 11.3 delays per 100,000. That’s a difference of around 22 times.
For this year and using this measure, the government’s figure is roughly correct.
Funding vs delivery
The King’s Fund, a health think tank, has said that an increase in the number of delayed discharges from hospital since last year is “undoubtedly driven” by pressures in the NHS and social care.
The most common reason for a delayed discharge so far in 2016/17 has been that patients were waiting for a care package at home. This was closely followed by waiting for other non-acute NHS care, waiting for an assessment to be completed and waiting for a place in a nursing home.
Depending on the reason for the delay and whether the patient was receiving acute or non-acute care there is some variation in whether the NHS, social care, or both are considered responsible for the delay. Looking at all delays together, the NHS is responsible for the most.
“Back in 2010 the overseas aid budget was around £7 billion a year. By 2020 it will have more than doubled to over £15 billion a year... surely the government priority should be to look after the elderly, vulnerable and disabled people in our own country, before we hand money over to other countries?”
Philip Davies MP, 14 December 2016
The UK’s overseas aid budget is rising steeply, although we can’t replicate these precise figures. The aid budget isn’t quite set to have "more than doubled" from 2010 to 2020—and certainly not once inflation is factored in.
The overseas aid budget for 2010 was about £8.5 billion. It had been £7.3 billion in 2009.
Overseas aid spending is based on a target of 0.7% of UK national income. So the amount we spend in 2020 will depend on how much the economy grows.
We’d expect to spend about £15.3 billion a year on overseas development aid in 2020, based on the latest economic forecasts from the Office for Budget Responsibility.
That’s roughly 1.8 times what we spent in 2010, in cash terms.
But inflation means that the same amount of money will pay for less over time. We’d expect our overseas aid budget in 2020 to be worth about £13.1 billion in 2010 prices, based on the Treasury’s forecasts for inflation.
That’s roughly 1.5 times what we spent in 2010, in terms of what the money can buy.
Another approach would be thinking about what we can afford as an economy. In 2010, we spent about 0.57% of the value of the economy on overseas development aid. If the overseas aid target is still there in 2020, we’ll spend 0.7%.
That would be closer to 1.2 times what we spent in 2010, as a percentage of our national income.
We’ve asked Mr Davies which figures he was referring to.
“Now we know, courtesy of the government’s own infrastructure watchdog, that mobile coverage is worse than Romania…”
Ian Blackford MP, 14 December 2016
The UK is lagging behind other countries, including Romania, when it comes to the availability of modern mobile phone signal, according to the National Infrastructure Commission.
It says that “the UK performs poorly in comparison to other countries when looking at the availability of 4G—a metric that captures how much of the time a phone is able to connect to the 4G network”.
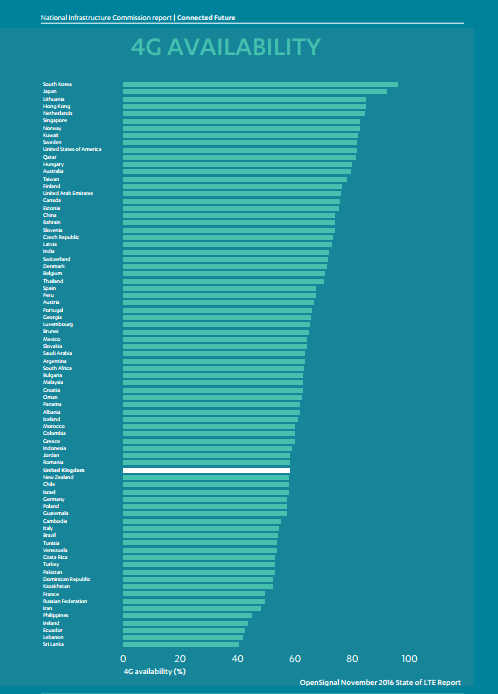
In the UK, users of the 4G network were able to connect 58% of the time on average. That’s below Romania (just about), Albania, and dozens of other developing and developed countries.
The speed of 4G in Romania was much better than in the UK, though (in fact it came 4th out of all the countries studied). Average 4G speed there was 35.61 Mbps compared to 21.16 Mbps in the UK.