What's happened to your pay packet in 5 graphs
Employment is up, but what about pay? Among the findings from the Annual Survey of Hours and Earnings (ASHE) published today by the ONS: we've had a £1 cash pay rise this year, real wages continue to fall, the gender 'pay gap' is narrowing and people in London earn lots.
Join 73,000 newsletter subscribers who trust us to check the facts
Sign up to get weekly updates on politics, immigration, health and more.
Subscribe to weekly email newsletters from Full Fact for updates on politics, immigration, health and more. Our fact checks are free to read but not to produce, so you will also get occasional emails about fundraising and other ways you can help. You can unsubscribe at any time. For more information about how we use your data see our Privacy Policy.
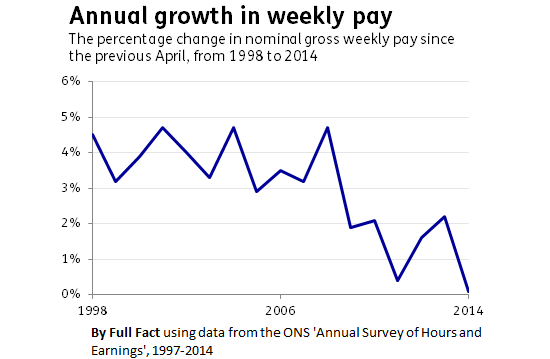
Slow growth in cash wages
The findings: Full time workers had the lowest growth in their median pre-tax weekly pay since the ONS first published this survey- in 1997. That is in cash terms—it doesn't take inflation into account. Median pay is the rate right in the middle of all UK salaries—so half of the population earn more than this, and half earn less.
What does this mean? This April, median pre-tax weekly pay for full time employees was £518. Last April it was £517—so it's only risen by £1. This is the lowest cash increase on record.
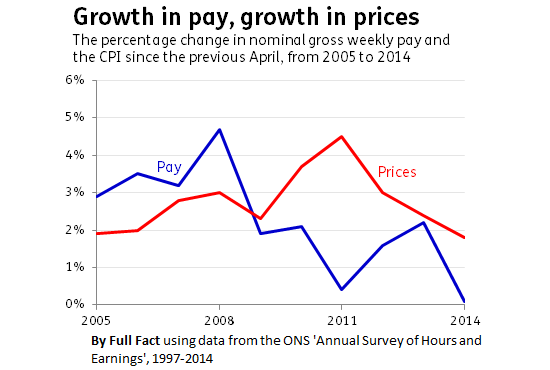
What about real pay?
The findings: Once increases in prices are considered, median pre-tax weekly pay fell 1.6% over the last year.
What does this mean? While pay was up over the past year, prices grew even faster. So there was a real terms pay cut.
Real pay has fallen every year since 2008, with the largest fall occurring in 2011.
The details: The median income can actually fall when wages for workers already in jobs are growing. This can happen if enough of the new jobs being created are low paid and tip the mid-point down.
So while the Chancellor pointed out today that employment has grown considerably over the past year, the Bank of England noted in August many of these new jobs were in lower skilled occupations. So wage growth in existing jobs may have been offset by the creation of new, lower paid jobs.
To avoid these effects, the ONS produce figures on the pay increases for people who have been in the same job for a year or more. However, this removes a lot of high turnover jobs (where workers are frequently replaced) from the stats—which often have poor pay progression. Similarly, we expect wages to increase with the length of time a person has been in a job, so this will give a higher growth rate.
For full-time workers in their job for a year or more, the median weekly pay increased by 4.1%.
These figures don't tell us how many hours people are working. If you are working longer hours for only a small increase in your cash-terms pay, then you may feel worse off than the real-terms fall in your wages would indicate. Similarly, overtime pay is not included in this measure.
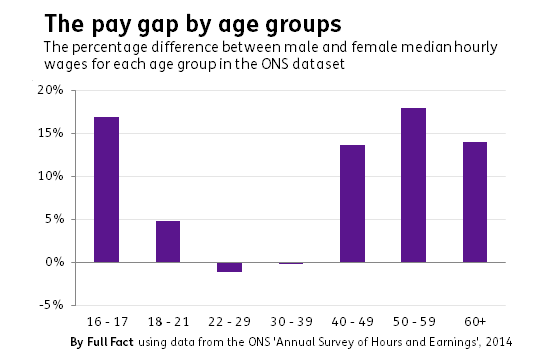
The lowest ever gender 'pay gap'
The finding: The 'pay gap' between men and women in full-time employment in April 2014 was 9.4%, compared with 10% in 2013. This is the lowest on record (when comparable measurements of pay have been used).
What this means: The ONS has measured the 'pay gap' by comparing how much the 'middle earning' man earns compared to the middle earning woman. This does not mean that men and women earn different amounts for the same work.
However, the 'pay gap' is not uniform across all age groups and regions: it actually becomes negative for people in the age ranges between 22 and 39. In other words, for full-time employees, the median woman actually earns more per hour than the median man does in these age groups. However, because men work more hours on average, median male weekly earnings are higher than median female weekly earnings within these groups.
Similarly, the median woman in full-time employment in Northern Ireland earns more each hour than the median Northern Irish man in full-time employment. This gap grew by 1.8 percentage points in the past year.
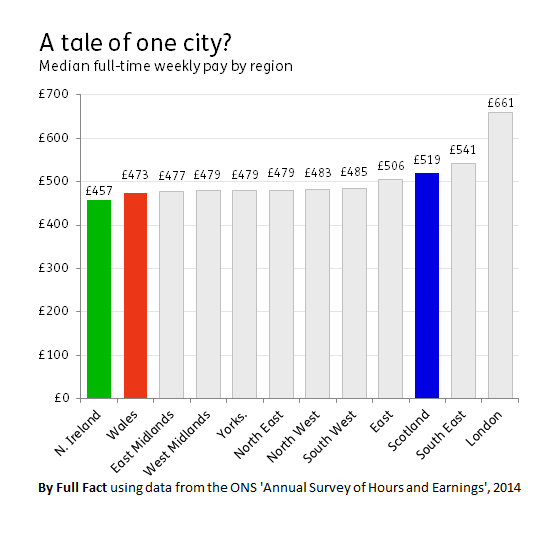
Regional differences in pay
The finding: People in London have the highest median pay for full time workers in the country.
What does this mean? The median London worker earns £660 per week, £119 more than in the next-best-paid region of the UK (the South East). This is more than £200 above the median worker in Northern Ireland.
However, pay also varied significantly across London. The median worker in the City earned £928 per week, while the median employee working in the borough of Newham took home £559 per week.