BBC Question Time, factchecked
Join 73,000 newsletter subscribers who trust us to check the facts
Sign up to get weekly updates on politics, immigration, health and more.
Subscribe to weekly email newsletters from Full Fact for updates on politics, immigration, health and more. Our fact checks are free to read but not to produce, so you will also get occasional emails about fundraising and other ways you can help. You can unsubscribe at any time. For more information about how we use your data see our Privacy Policy.
“I’ve got a couple of friends who are MPs, Conservative MPs actually, and I don’t think they are paid enough. The chief executives of Anglesey County Council and Gwynedd County Council are paid about three times more than an MP.”
BBC Question Time audience member, 23 March 2017
It’s not correct to say these Chief Executives are paid three times more than MPs.
The Chief Executive of Isle of Anglesey County Council in north-west Wales gets paid £113,000 a year. In neighbouring Gwynedd, it’s between £103,000 and £110,000.
The basic salary for a Member of Parliament anywhere in the UK is £76,000.
All these salaries are for the financial year beginning on 1 April 2017. The gap used to be wider. In 2014, for example, MPs were paid £67,000 and the Chief Executive at Anglesey £141,000—so about twice as much.
And exceptionally in 2010/11, when an Interim Managing Director was appointed to the council by the Welsh government, the salary was over three times that of an MP. The gentleman in the audience may have been thinking of that.
Council Chief Executives also oversee elections in their area, for which they can get extra fees. The Anglesey Chief Executive received an extra £3,000 for these duties a few years ago, according to a report by a Welsh Assembly committee, although we’re not sure how typical that is for this council. We’ve asked.
Whatever the situation is in these specific councils, the audience member may have a point in general. The average county council Chief Executive was paid something close to three times as much as an MP in 2012/13, according to a report by a committee of the latter using data from IDS Thomson Reuters, although they doesn’t specify whether it covers Wales as well as England
But comparing the salaries of local government senior managers with public representatives isn’t comparing like with like. They’re very different jobs.
Increases in MPs’ salaries are linked to average earnings across the whole of the public sector by the Independent Parliamentary Standards Authority, although it points out that the job is “in many respects unique and performed in different ways by different MPs”.
“The policing minister has mentioned a few times the police are doing a great job. Well why then every year are you cutting police budgets?”
BBC Question Time audience member, 23 March 2017
“Over the last few years we have had to make some really difficult decisions around public sector spending … In the budget last year we protected police spending and we've also increased the spending on this area: counter-terrorism, is going up 30%.”
Brandon Lewis, 23 March 2017
“You have cut spending by 25% over five years”
David Dimbleby, 23 March 2017
Everyone has a point. Police funding in England and Wales has fallen over the last five years, and it’s expected to stay flat over the next five. The government itself won’t be putting in all the money to achieve that—it will only be flat if local forces choose to raise additional money themselves.
The government also plans to increase counter-terrorism funding by 30% over this parliament.
Police funding is devolved in Scotland and there are separate arrangements for Northern Ireland.
Police funding fell from 2010/11 to 2015/16
That’s according to estimates compiled by the National Audit Office. Overall funding fell by 18%, taking inflation into account. That compares to a 31% increase in funding between 2000/01 and 2010/11.
That 18% isn’t what the government itself has cut from the budget. Direct government funding has fallen by 25% over the same period, which is what David Dimbleby is referring to. Most of the police budget comes from central government, but forces can also raise money locally via council taxes and this pot increased slightly over the period. That’s why, overall, it’s an 18% loss of funding.
This varies a lot locally. That 18% average ranges from a 12% fall in Surrey police force to a 23% fall in Northumbria. This is mainly because some forces, like Northumbria, rely more heavily on government grants and don’t raise as much locally. Surrey, by contrast, was the only police force last year to raise more money locally than it got from the government.
Government funding to the police will fall this parliament, but local forces can raise the difference themselves
The 2015 Spending Review promised to “protect overall police spending in real terms over the Spending Review period”—up to 2019/20, and that’s reflected in more detailed estimates the government has published.
The central government part of that is actually expected to fall in real terms. It only stays flat overall if local Police and Crime Commissioners raise the maximum they’re allowed to.
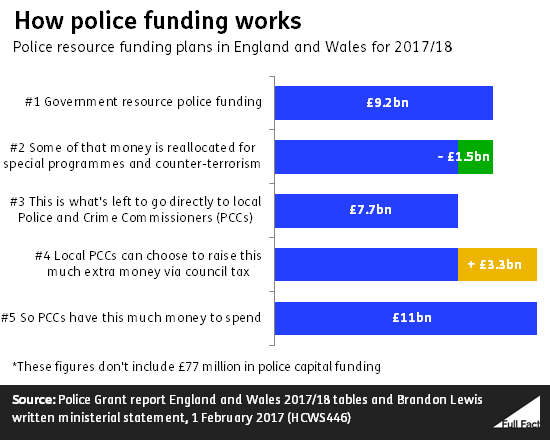
The government plans to spend 30% more on counter-terrorism by the end of the decade
A small part of government police funding is ring-fenced for counter-terrorism, but the allocations to local areas aren’t published for security reasons.
In the 2015 Spending Review, the government committed to “spend 30% more overall in real terms on key counter-terrorism capabilities over the Parliament”. This was reiterated by Theresa May in response to this week’s terror attacks in London.
In 2017/18, £675 million has been set aside for counter-terrorism from government resource funding of about £9.2 billion.
“We have got 23% of people living in poverty here in Wales.”
Leanne Wood AM, 23 March 2017
This is correct using the relative measure of poverty, and absolute poverty is similar, estimated at 22%.
23% of people in Wales lived in a household where the income is below 60% of the UK median between 2013/14 and 2015/16. That’s including housing costs, and is roughly 700,000 people.
These levels have been roughly the same for the past decade, and slightly higher than other UK countries. The most recent figure for England is 22%, 20% for Northern Ireland and 19% for Scotland.
An alternative measure is absolute poverty. This is where, instead of comparing people relative to the rest of the population, people are measured against a fixed standard of living. The government chooses to use the relative poverty line in 2010/11, adjusted for inflation.
22% of people in Wales lived in absolute poverty between 2013/14 and 2015/16. Again, that’s including housing costs and about 700,000 people. It’s still higher than 21% in England, 20% in Northern Ireland and 18% in Scotland.
For both relative and absolute measures, the figures before housing costs are taken into account are a little bit lower.
There are issues with using both absolute and relative measures of poverty to understand inequality in the UK. If you are interested, take a look at our piece here.
“Wales has a fiscal deficit currently of just under 25% compared to the UK deficit of 5%.”
BBC Question Time audience member, 24 March 2017
This probably gives a fair sense of the scale of the difference, even though the latest figures we’ve found are slightly out-of-date.
A “fiscal deficit” is the gap between what the government earns and spends.
There isn’t an official government estimate for the size of the gap in Wales and it’s not simple to work out.
You need to combine estimates for how much public money is spent on Welsh people with how much they pay in taxes.
It’s not always obvious. Things like income tax, for example, are collected at the UK level by HMRC. Some government spending benefits the UK as a whole, rather than specific regions.
Wales’ fiscal deficit was about £13 billion in 2014/15, according to the Wales Governance Centre at Cardiff University. This equalled about 24% of Welsh GDP, the value of goods and services produced in Wales.
The UK had a fiscal deficit worth about 5% of GDP in the same year (that’s the whole of the UK, including Wales).
Wales’s fiscal deficit has fallen in the past few years, as has the UK’s as a whole. Its deficit will have been smaller last year if it continued to fall in line with the rest of the UK.
We’ve asked the report’s authors when a comparison for 2015/16 and 2016/17 will be available.
Since the quality of Scottish GDP estimates has been questioned recently we’re also looking into whether similar criticisms would apply to this report, which takes a similar approach. For now these estimates seem to be the best available.
“I do think we need to listen very carefully to the people of Wales. 94% of the people of Wales have repeatedly shown in poll after poll that actually, whilst being very proud to be Welsh, we are actually not in the least bit interested in an independent Wales.”
Nia Griffith MP, 23 March 2017
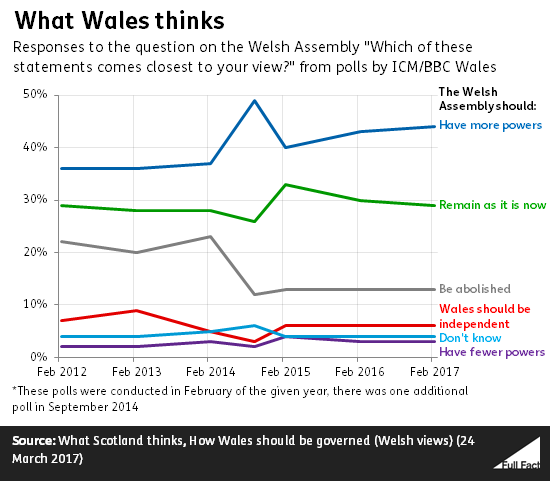
Polls conducted over the last five years clearly show that supporters of Welsh independence are in a minority, but the exact proportion varies depending on how the question is phrased.
Since 2012 BBC Wales has commissioned regular polls on how people in Wales think they should be governed. On average these found that 6% of people thought Wales should be independent.
The most popular view was that the Welsh Assembly should get more powers (41% of people on average said this), followed by the Welsh Assembly’s powers staying the same (29%). Around 17% of people thought that the Welsh Assembly should be abolished altogether and roughly 3% said it’s powers should be reduced. The rest didn’t know or didn’t say.
The same poll also had questions tied to specific events. One asked how people thought they’d vote on the issue of Welsh independence if Scotland were to become independent first. 19% of people said they would vote ‘Yes’, compared to 17% of people when the same question was asked two years before. 61% of people said that they’d vote ‘No’, compared to 69% in 2014.
Another asked people whether they’d vote for Welsh independence if it meant Wales could stay in the EU while the rest of the UK left. 28% of people said they’d vote for independence while 53% of people said they’d vote against it. The rest didn’t know or wouldn’t say.
Lastly, we’ve had questions from readers asking us whether polls are accurate reflections of public opinion. We hope to address this question in a future piece.